
Integrated Computational Materials Engineering (ICME)
Atomistic Deformation of Amorphous Polyethylene
Abstract
Molecular dynamics simulations were used to study deformation mechanisms during uniaxial tensile deformation of an amorphous polyethylene polymer. The stress-strain behavior comprised elastic, yield, strain softening and strain hardening regions that were qualitatively in agreement with previous simulations and experimental results. The chain lengths, number of chains, strain rate and temperature dependence of the stress-strain behavior were investigated. The energy contributions from the united atom potential were calculated as a function of strain to help elucidate the inherent deformation mechanisms within the elastic, yield, and strain hardening regions. The results of examining the partitioning of energy show that the elastic and yield regions were mainly dominated by interchain non-bonded interactions whereas strain hardening regions were mainly dominated by intrachain dihedral motion of polyethylene. Additional results show how internal mechanisms associated with bond length, bond angle, dihedral distributions, change of free volume and chain entanglements evolve with increasing deformation. See our papers for more information[1][2].
Author(s): Mark A. Tschopp, Delwar Hossain, Mark F. Horstemeyer
Methodology
Interatomic Potential
The interatomic force field for polyethylene is based on a united atom model using the Dreiding potential. There were several reasons why this potential was chosen. First, this study investigates uniaxial deformation of amorphous polyethylene systems with large numbers of monomers (20,000 to 200,000 united atoms) as a function of strain rates that vary over three orders of magnitude (108 to 1010 s-1). Full atom representations would require approximately three times the number of atoms (i.e., carbon plus two hydrogens) along with a more computationally-expensive force field and, quite possibly, a smaller timestep or different integration scheme due to adding hydrogen. Additionally, the 108 s-1 strain rate in these simulations requires millions of timesteps to reach strains of approximately 100%. Therefore, the use of the united atom model and Dreiding potential was influenced in part by the computational expense. Second, much of the prior literature regarding molecular dynamics simulations of polyethylene have used the Dreiding potential. In this sense, this work can build upon results previously obtained, while also providing guidance as to the influence of chain length, number of chains, temperature, and strain rates when moving to full atom representations with optimized force fields. We leave deformation of full-atom polymer representations for future work.
The united atom model used here considers each methyl group (i.e., the CH2 monomer) as a single atom with a force field that determines the interactions between united atoms. The Dreiding potential is used to describe these interactions. The Dreiding potential has four contributing terms; bond stretching, changes in bond angle, changes in dihedral rotation, and van der Waals non-bonded interactions.
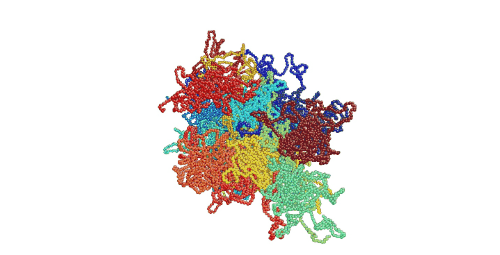
Figure 1. Movie showing deformation of an amorphous polyethylene structure with 20 chains of 1000 monomers length. The strain rate is 1010 s-1 and the temperature is 100 K.
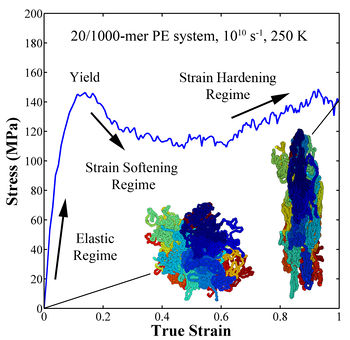
Figure 2. Stress-strain curve for amorphous polyethylene.
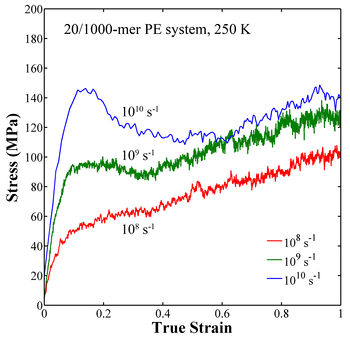
Figure 2. Stress-strain curve for amorphous polyethylene.
Deformation Simulations
A parallel molecular dynamics code, LAMMPS[3], that incorporates domain decomposition is used to deform the polymer simulation cells. A Nosé-Hoover thermostat was used to regulate the system temperature. The mechanical responses from three different initial configurations were averaged to account for entropic effects due to the high number of possible chain configurations. The link below shows an animation of uniaxial loading of polyethylene.
The initial chain structure was created using a method similar to those previously developed using Monte Carlo self-avoiding random walks. The chain generation step used a face-centered cubic (FCC) lattice superimposed on the simulation cell with the nearest neighbor distance of 1.53 Å. Molecules were added to the lattice in a probabilistic stepwise manner, which based the probability of chain growth in certain directions on the bond angle and the density of unoccupied sites. This chain structure was then formatted into a LAMMPS data file.
This initial structure was then inserted into the molecular dynamics code where an equilibration sequence was performed prior to deforming the amorphous polymer. The equilibration sequence relaxes any high energy configurations that are artificially created due to the FCC lattice used to generate the amorphous polymer structure. The relaxation involves four different steps. Initially, the simulation ran for 10,000 timesteps (Δt=1 fs) using NVT dynamics at 500 K followed by relaxation for 50,000 timesteps (Δt=0.5 fs) using NPT dynamics at 500 K. The next relaxation cooled the structure down to the desired temperature for 50,000 timesteps followed by further relaxation of 50,000 timesteps at the desired temperature.
The amorphous PE system was then deformed under a uniaxial tensile strain applied at a constant strain rate with a zero-pressure condition for the two lateral simulation cell faces. This deformation condition was implemented in LAMMPS by decoupling the boundary in the loading direction from the NPT equations of motion. In addition to calculating the stress as a function of strain, the energy contributions associated with the bond length, bond angles, dihedral angle and non-bonding interactions were tracked as a function of strain. Periodic dumps of the atomic configuration were performed to compute additional microstructure metrics such as chain orientation or the percentage of trans dihedral conformations. Three different strain rates (108, 109, and 1010 s-1) were used with an initial configuration consisting of 20 polymeric chains, each having 1000 monomers, to investigate the effect of strain rate. To investigate the influence of chain length and chain number, polyethylene configurations were uniaxially deformed at a stain rate of 10
Running a Polymer Deformation Example
LAMMPS Input Script
Here is an example LAMMPS input script. The 'fname' variable is the name of the LAMMPS data file which contains the atom positions along with all of the bond, angle, and dihedral angle lists. An example LAMMPS datafile for PE is attached below after the input script.
#####################################################
#                                                   #
# DEFORM DREIDING LAMMPS INPUT SCRIPT               #
#                                                   #
# Filename: in.deform_dreiding.txt                  #
# Author: Mark Tschopp, 2010                        #
#                                                   #
# The methodology outlined here follows that from   #
# Hossain, Tschopp, et al. 2010, Polymer.  Please   #
# cite accordingly. The following script requires   #
# a LAMMPS data file containing the coordinates and #
# appropriate bond/angle/dihedral lists for each    #
# united atom.                                      #
#                                                   #
# Execute the script through:                       #
# lmp_exe < in.deform_dreiding.txt                  #
#                                                   #
#####################################################

# VARIABLES
variable fname index PE_nc10_cl1000.dat
variable simname index PE_nc10_cl1000

# Initialization
units		real
boundary	p p p
atom_style	molecular
log 		log.${simname}.txt
read_data	${fname}

# Dreiding potential information
neighbor	0.4 bin
neigh_modify	every 10 one 10000
bond_style      harmonic
bond_coeff	1 350 1.53
angle_style     harmonic
angle_coeff	1 60 109.5
dihedral_style	multi/harmonic
dihedral_coeff	1 1.73 -4.49 0.776 6.99 0.0
pair_style	lj/cut 10.5
pair_coeff	1 1 0.112 4.01 10.5

#####################################################
# Equilibration Stage 1 (Langevin dynamics at 500 K)
velocity 	all create 500.0 1231
fix		1 all nve/limit 0.05
fix		2 all langevin 500.0 500.0 10.0 904297
thermo_style	custom step temp press
thermo          100
timestep	1
run		10000
unfix 1
unfix 2
write_restart 	restart.${simname}.dreiding1

#####################################################
# Equilibration Stage 2 (NPT dynamics at 500 K)
fix		1 all npt temp 500.0 500.0 50 iso 0 0 1000 drag 2
fix  		2 all momentum 1 linear 1 1 1
thermo_style	custom step temp press
thermo          100
timestep	0.5
reset_timestep	0
run		50000
unfix 1
unfix 2
write_restart 	restart.${simname}.dreiding2

#####################################################
# Equilibration Stage 3 (NPT dynamics from 500 K --> 100 K)
fix		1 all npt temp 500 100 50 iso 0 0 1000 drag 2
fix		2 all momentum 1 linear 1 1 1
thermo_style	custom step temp press
thermo          10
timestep	0.5
reset_timestep 	0
run		50000
unfix 1
unfix 2
write_restart 	restart.${simname}.dreiding3

#####################################################
# Equilibration Stage 4 (NPT dynamics at 100 K)
fix		1 all npt temp 100 100 50 iso 0 0 1000 drag 2
fix		2 all momentum 1 linear 1 1 1
thermo_style	custom step temp press epair ebond eangle edihed pxx pyy pzz lx ly lz
thermo          10
timestep	0.5
reset_timestep 	0
run		50000
unfix 1
unfix 2
write_restart 	restart.${simname}.dreiding4

#####################################################
# Uniaxial Tensile Deformation
run 0
variable tmp equal "lx"
variable L0 equal ${tmp}
variable strain equal "(lx - v_L0)/v_L0"
variable p1 equal "v_strain"
variable p2 equal "-pxx/10000*1.01325"
variable p3 equal "-pyy/10000*1.01325"
variable p4 equal "-pzz/10000*1.01325"
variable p5 equal "lx"
variable p6 equal "ly"
variable p7 equal "lz"
variable p8 equal "temp"
variable t2 equal "epair"
variable t3 equal "ebond"
variable t4 equal "eangle"
variable t5 equal "edihed"
fix		1 all npt temp 100 100 50 y 0 0 1000 z 0 0 1000 drag 2
fix		2 all deform 1 x erate 1e-5 units box remap x
fix def1 all print 100 "${p1} ${p2} ${p3} ${p4} ${p5} ${p6} ${p7} ${p8}" file ${simname}.def1.txt screen no
fix def2 all print 100 "${p1} ${t2} ${t3} ${t4} ${t5}" file ${simname}.def2.txt screen no
thermo_style	custom step temp pxx pyy pzz lx ly lz epair ebond eangle edihed
thermo          100
timestep	1
reset_timestep	0
run		171800
unfix 1
unfix 2
unfix def1
unfix def2

print "All done"
LAMMPS Polymer Datafile
Here is an example datafile for a polyethylene system with 10 chains of 1000 monomers each. Download this file and add this to the directory with the LAMMPS input script above.
Within the file there are several sections. The first section describes the number of atoms, bonds, angles, and dihedrals so that LAMMPS can initialize the arrays and so LAMMPS knows how many values to read in. Also, this sets the number of different atom/bond/angle/dihedral types, the periodic box bounds, and the corresponding masses for the atomtypes. Last, the coordinates of the united atoms for polyethylene are given along with the atom ID, chain number, and atom type in the first, second, and third columns, respectively.
# Model for PE

     10000     atoms
      9990     bonds
      9980     angles
      9970     dihedrals

         1     atom types
         1     bond types
         1     angle types
         1     dihedral types

    0.0000   80.0586 xlo xhi
    0.0000   80.0586 ylo yhi
    0.0000   80.0586 zlo zhi

Masses

         1          14.02

Atoms

         1         1         1    8.6550   61.6668    5.4094
         2         1         1    8.6550   60.5849    6.4912
         3         1         1    7.5731   59.5030    6.4912
         4         1         1    6.4912   60.5849    6.4912
         5         1         1    6.4912   61.6668    7.5731
         6         1         1    5.4094   62.7487    7.5731
         7         1         1    4.3275   62.7487    6.4912
         8         1         1    3.2456   62.7487    7.5731
         9         1         1    2.1637   61.6668    7.5731
        10         1         1    1.0819   61.6668    8.6550
After the united atom coordinates, the bond list, angle list, and dihedral list data is listed. For instance, the first entry in the bond has an ID (1), a bond type (1), and the bond is between 2 atoms, atom ID 1 and atom ID 2, and so forth for all 9990 bonds in this system.
Bonds

         1         1         1         2
         2         1         2         3
         3         1         3         4
         4         1         4         5
         5         1         5         6
         6         1         6         7
         7         1         7         8
         8         1         8         9
         9         1         9        10
        10         1        10        11
...

Angles

         1         1         1         2         3
         2         1         2         3         4
         3         1         3         4         5
         4         1         4         5         6
         5         1         5         6         7
         6         1         6         7         8
         7         1         7         8         9
         8         1         8         9        10
         9         1         9        10        11
        10         1        10        11        12
...

Dihedrals

         1         1         1         2         3         4
         2         1         2         3         4         5
         3         1         3         4         5         6
         4         1         4         5         6         7
         5         1         5         6         7         8
         6         1         6         7         8         9
         7         1         7         8         9        10
         8         1         8         9        10        11
         9         1         9        10        11        12
        10         1        10        11        12        13
...
Running the simulation
- Download the input script
- Download the attached LAMMPS datafile, Media:PE_nc10_cl1000.dat
- Type 'lmp_exe < in.deform_dreiding.txt'
Questions
Reducing fluctuations
Since the pressure component during the deformation process has great fluctuations, how did you solve this issue? How do you obtain the relatively smooth uniaxial tension stress-strain curves using the output pressure components such as Pxx, Pyy and Pzz?
- We typically use multiple instantiations, i.e., use multiple starting configurations to generate some average response.
- You can deform each microstructure instantiation in multiple directions, in x-, y-, and z-directions.
- We used a local regression technique with a 2nd degree polynomial model to reduce fluctuations (i.e., MATLAB's smooth function with loess or rloess).
- Take lots of data points, so the regression model has something to work with!
- Increasing the size of the system should help, too. Actually, if you have access to a large number of processors, run as big of a system as possible for your problem to average out these fluctuations. Multiple instantiations or loading in multiple directions may not be needed if your system size is big enough. This helps with postprocessing as well.
Making movies
Q: How did you make the deformation movies?
A: I wrote a MATLAB script to unwrap the polymer chains outside the periodic boundaries and then used AtomEye to visualize deformation. I'll try to add this to the webpage at some point.
Conclusions
Molecular dynamics (MD) simulations were used to study the main deformation mechanisms responsible during uniaxial tensile loading of an amorphous polyethylene (PE)-like polymer. These simulations were performed for different strain rates and temperatures under uniaxial tensile loading to investigate the influence of these external factors on mechanical properties of PE polymer. Results show that many mechanical properties of PE can be simulated by MD in qualitative some times in quantitative agreement with experiments.
- The simulated stress-strain behavior at the strain rate of 1010 s-1 shows the same trends as those observed in experimental testing for amorphous polymers, i.e., an elastic regime followed by a yield peak and subsequent softening and strain hardening regimes. The characteristic yield peak observed in polymers decreases with increasing temperature and decreasing strain rate. This difference provided the contrast between conditions that was necessary for exploring what mechanisms were responsible for the characteristic yield peak in polymers. Overall the strain rate and temperature have much stronger effect on the behavior than chain length and number of chains, which show little effect on the stress-strain behavior.
- In the elastic and yield peak regimes, the energy evolution plots show that interchain non-bonded (Van der Waal’s) interactions played a significant role, as shown by the amount of the total potential energy increase that is due to the non-bonded energy. This increase in energy is later associated with an increase in the free volume, which is required prior to intrachain torsional processes for some conditions. The evolution of free volume also suggests that Poisson’s ratio evolves within the elastic regime.
- In the strain softening and hardening regimes, the energy evolution plots show that intrachain torsion mechanisms played a significant role. This decrease in dihedral energy is later associated with the transformation of gauche conformations to lower energy trans conformations. Additionally, an entanglement parameter calculated from the intrachain geometry shows that the majority of disentanglement occurs in this regime.
- The present simulations clearly show that the bond length and bond angle distributions remain nearly constant over all regimes for all conditions. This is also supported by the minimal change in energy associated with bond length and bond angle compared to the non-bonding and dihedral energy changes.
- Chain alignment in the direction of loading increases with increasing strain over all regimes.
Future investigation will focus in building a hierarchical multiscale approach using the information obtained from the molecular dynamic scale (e.g. evolution of free volume and entanglement density with deformation, strain rate, temperature) to refine the continuum level constitutive model.
Acknowledgments
The authors would like acknowledge financial support through the Center for Advanced Vehicular Systems at Mississippi State University. Additionally, the authors would like to acknowledge the insightful comments from the reviewers during the review process.
References
- ↑ Hossain, D., Tschopp, M.A., Ward, D.K., Bouvard, J.L., Wang, P., Horstemeyer, M.F., "Molecular dynamics simulations of deformation mechanisms of amorphous polyethylene," Polymer, 51 (2010) 6071-6083.
- ↑ Tschopp, M.A., Ward, D.K., Bouvard, J.L., Horstemeyer, M.F., "Atomic Scale Deformation Mechanisms of Amorphous Polyethylene under Tensile Loading," TMS 2011 Conference Proceedings.
- ↑ S. Plimpton, "Fast Parallel Algorithms for Short-Range Molecular Dynamics," J. Comp. Phys., 117, 1-19 (1995).