
Integrated Computational Materials Engineering (ICME)
Errorbars Plot
Abstract
This example shows how to plot a journal quality plot in MATLAB with errorbars. This is my tried and true methodology for producing eps and pdf figures in MATLAB!
Author(s): Mark A. Tschopp
MATLAB Script
This shows a plot for stress as a function of strain for a fictitious material with fictitious errors at every point. The plot can be saved as a MATLAB figure after it appears. Additionally, the exportfig command, which refers to a script that can be downloaded at the MATLAB Central File website, exports the plot to a jpeg, tiff, or eps file.
x = 0.01:0.01:1;
y = log(x); y = y - y(1);
err_lo = x.*(1+rand(size(x)))/2;
err_hi = x.*(1+rand(size(x)))/2;

% Plot this if you want to see the band of low, high, and mean behavior
plot(x,y,'.r'), hold on
plot(x,y-err_lo,'.b')
plot(x,y+err_hi,'.k')
close(1)

% Journal quality plot
plot(x,y,'-dr','LineWidth',2,'MarkerSize',3,'MarkerFaceColor','r'), hold on
% Use this to select errorbars every 10 datapoints
n = 1:10:100;
% ... or do this for only specific data points
n = [25, 35, 75, 85 90];
errorbar(x(n),y(n),err_lo(n),err_hi(n),'or','MarkerSize',5,'MarkerFaceColor','r','LineWidth',2)
symbol = 'or';
head_width = 25;
hh = herrorbar(x(n),y(n),err_lo(n)/6,err_hi(n)/6,head_width,symbol);
set(hh,'LineWidth',2)

axis square
ylim([0 6]), xlim([0 1])
set(gca,'LineWidth',2,'FontSize',24,'FontWeight','normal','FontName','Times')
set(get(gca,'XLabel'),'String','Strain, \epsilon','FontSize',32,'FontWeight','bold','FontName','Times')
set(get(gca,'YLabel'),'String','Stress, \sigma (MPa)','FontSize',32,'FontWeight','bold','FontName','Times')
set(gcf,'Position',[1 1 1000 1000])

exportfig(gcf,'plot1_pro.jpg','Format','jpeg','Color','rgb','Resolution',300)
exportfig(gcf,'plot1_pro.eps','Format','eps','Color','rgb','Resolution',300)
close(1)
The eps file can be directly used for journal papers or converted to pdf format, depending on preference. This formats are often useful for LaTEX and pdfLaTEX. The jpeg file can be used for Powerpoint presentations and the like (sometimes Powerpoint doesn't render eps images well). This file needs the herrorbar utility, which can be found at [1]. I made a slight modification to adjust the size of the head width on the horizontal error bars, so that they match the vertical error bars, i.e.,
function hh = herrorbar(x, y, l, u, head_width, symbol)
%HERRORBAR Horizontal Error bar plot.
%   HERRORBAR(X,Y,L,R) plots the graph of vector X vs. vector Y with
%   horizontal error bars specified by the vectors L and R. L and R contain the
%   left and right error ranges for each point in X. Each error bar
%   is L(i) + R(i) long and is drawn a distance of L(i) to the right and R(i)
%   to the right the points in (X,Y). The vectors X,Y,L and R must all be
%   the same length. If X,Y,L and R are matrices then each column
%   produces a separate line.
%
%   HERRORBAR(X,Y,E) or HERRORBAR(Y,E) plots X with error bars [X-E X+E].
%   HERRORBAR(...,'LineSpec') uses the color and linestyle specified by
%   the string 'LineSpec'. See PLOT for possibilities.
%
%   H = HERRORBAR(...) returns a vector of line handles.
%
%   Example:
%      x = 1:10;
%      y = sin(x);
%      e = std(y)*ones(size(x));
%      herrorbar(x,y,e)
%   draws symmetric horizontal error bars of unit standard deviation.
%
%   This code is based on ERRORBAR provided in MATLAB.
%
%   See also ERRORBAR

%   Jos van der Geest
%   email: jos@jasen.nl
%
%   File history:
%   August 2006 (Jos): I have taken back ownership. I like to thank Greg Aloe from
%   The MathWorks who originally introduced this piece of code to the
%   Matlab File Exchange.
%   September 2003 (Greg Aloe): This code was originally provided by Jos
%   from the newsgroup comp.soft-sys.matlab:
%   https://newsreader.mathworks.com/WebX?50@118.fdnxaJz9btF^1@.eea3ff9
%   After unsuccessfully attempting to contact the orignal author, I
%   decided to take ownership so that others could benefit from finding it
%   on the MATLAB Central File Exchange.

if min(size(x))==1,
    npt = length(x);
    x = x(:);
    y = y(:);
    if nargin > 2,
        if ~isstr(l),
            l = l(:);
        end
        if nargin > 3
            if ~isstr(u)
                u = u(:);
            end
        end
    end
else
    [npt,n] = size(x);
end

if nargin == 3
    if ~isstr(l)
        u = l;
        symbol = '-';
    else
        symbol = l;
        l = y;
        u = y;
        y = x;
        [m,n] = size(y);
        x(:) = (1:npt)'*ones(1,n);;
    end
end

if nargin == 4
    if isstr(u),
        symbol = u;
        u = l;
    else
        symbol = '-';
    end
end

if nargin == 2
    l = y;
    u = y;
    y = x;
    [m,n] = size(y);
    x(:) = (1:npt)'*ones(1,n);;
    symbol = '-';
end

u = abs(u);
l = abs(l);

if isstr(x) | isstr(y) | isstr(u) | isstr(l)
    error('Arguments must be numeric.')
end

if ~isequal(size(x),size(y)) | ~isequal(size(x),size(l)) | ~isequal(size(x),size(u)),
    error('The sizes of X, Y, L and U must be the same.');
end

tee = (max(y(:))-min(y(:)))/head_width; % make tee .02 x-distance for error bars
% changed from errorbar.m
xl = x - l;
xr = x + u;
ytop = y + tee;
ybot = y - tee;
n = size(y,2);
% end change

% Plot graph and bars
hold_state = ishold;
cax = newplot;
next = lower(get(cax,'NextPlot'));

% build up nan-separated vector for bars
% changed from errorbar.m
xb = zeros(npt*9,n);
xb(1:9:end,:) = xl;
xb(2:9:end,:) = xl;
xb(3:9:end,:) = NaN;
xb(4:9:end,:) = xl;
xb(5:9:end,:) = xr;
xb(6:9:end,:) = NaN;
xb(7:9:end,:) = xr;
xb(8:9:end,:) = xr;
xb(9:9:end,:) = NaN;

yb = zeros(npt*9,n);
yb(1:9:end,:) = ytop;
yb(2:9:end,:) = ybot;
yb(3:9:end,:) = NaN;
yb(4:9:end,:) = y;
yb(5:9:end,:) = y;
yb(6:9:end,:) = NaN;
yb(7:9:end,:) = ytop;
yb(8:9:end,:) = ybot;
yb(9:9:end,:) = NaN;
% end change


[ls,col,mark,msg] = colstyle(symbol); if ~isempty(msg), error(msg); end
symbol = [ls mark col]; % Use marker only on data part
esymbol = ['-' col]; % Make sure bars are solid

h = plot(xb,yb,esymbol); hold on
h = [h;plot(x,y,symbol)];

if ~hold_state, hold off; end

if nargout>0, hh = h; end
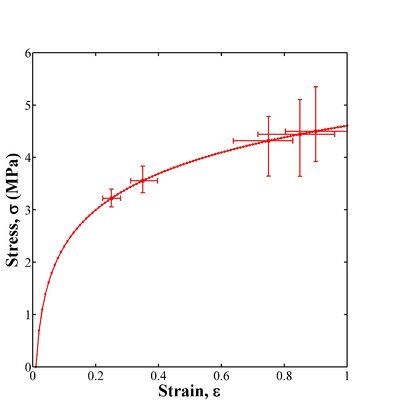
Figure 1. Stress-strain curve with vertical and horizontal errorbars at selected points.