
Integrated Computational Materials Engineering (ICME)
Characterization and Failure Analysis of A Polymeric Clamp Hanger Component
Abstract
This paper characterizes the failure of a polymeric clamp hanger component using finite element analysis coupled with experimental methods such as scanning electron microscopy, x-ray computed tomography, and mechanical testing. Using Fourier transform infrared spectroscopy, the material was identified as a polypropylene. Internal porosity that arose from the manufacturing procedure was determined using three dimensional x-ray computed tomography. From static mechanical experiments, the forces applied on the component were determined and used in a finite element simulation, which clearly showed the process of fracture arising from the pre-existing processing pores. The fracture surfaces were observed under a scanning electron microscope confirming the finite element simulation results illustrating that low-cycle fatigue fracture occurred in which the fatigue cracks nucleated from the manufacturing porosity.
Figures

Figure 1: Product and Fractured Component - Clamp Hanger

Figure 2: Product and Fractured Component - Fractured Polymer Grip
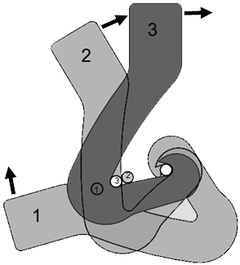
Figure 3: Illustration of grip closure. In Position 1, the clasp is completely opened and unloaded. In Position 2, the clasp is being closed and is contacting the steel bars. In Position 3, the clasp is fully closed and locked into the operating position.
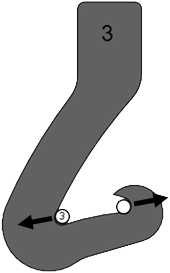
Figure 4: The static loads imparted from the rods on the “clasp” during operation.
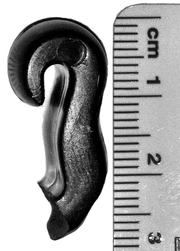
Figure 5: Fractured surfaces of a failed grip during operation - side view
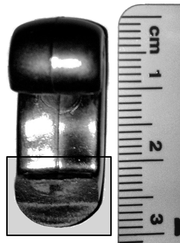
Figure 6: Fractured surfaces of a failed grip during operation - cross-section view
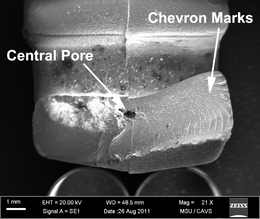
Figure 7: Fractured surfaces of a failed grip during operation - scanning electron micrograph of fractured surface of the boxed area in Figure 6
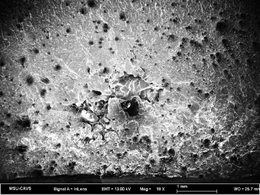
Figure 8: ESEM image of fractured surface - magnification of the central pore
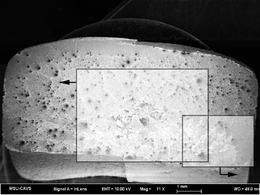
Figure 9: ESEM image of fractured surface - overall fracture surface
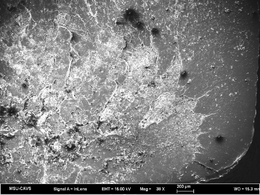
Figure 10: ESEM image of fractured surface - discolored edge
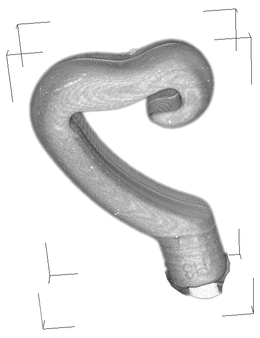
Figure 11: Micro X-ray computed tomography scans on the clasp - overall 3-D rendering
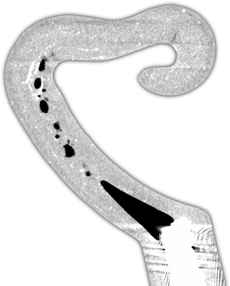
Figure 12: Micro X-ray computed tomography scans on the clasp - a central cross-section image showing porosity line the left side
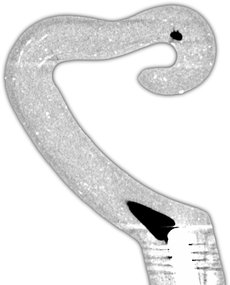
Figure 13: Micro X-ray computed tomography scans on the clasp - a cross-section image showing porosity line the right side
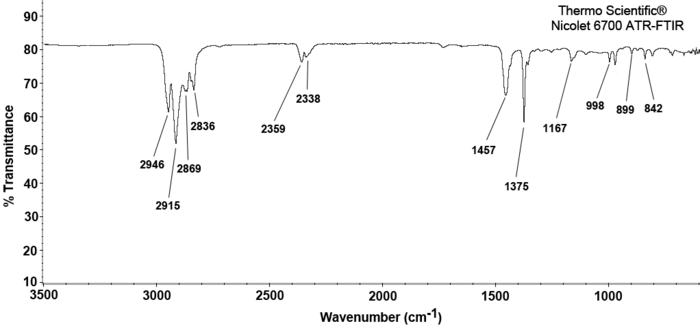
Figure 14: The FTIR spectrum of the specimen used in this study with the characteristic transmittance bands matching those of isotactic polypropylene (iso-PP)
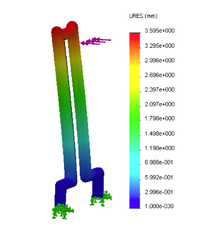
Figure 15: Finite element compliance study of the steel rods - elastic simulation of a single rod subjected to 100 N showing the displacement
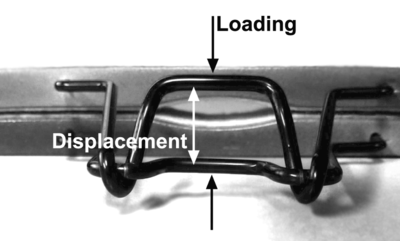
Figure 16: Finite element compliance study of the steel rods - illustration of the compliance directions of the rods
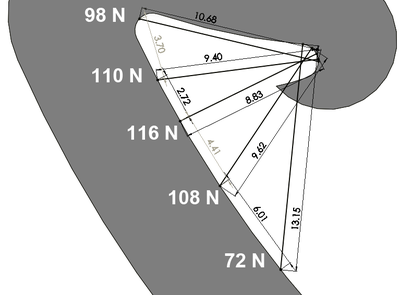
Figure 17: Estimated normal load at various rod positions during closure.
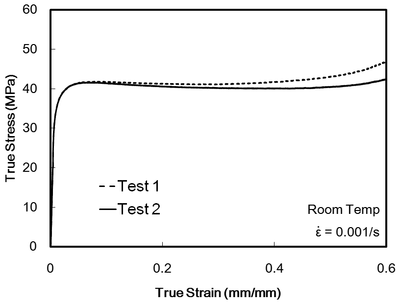
Figure 18: Compressive stress–strain response of the polypropylene clasp.

Figure 19: Solid models for finite element analysis - whole model without pores

Figure 20: Solid models for finite element analysis - cross-section of model to show pores
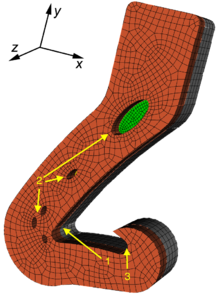
Figure 21: Cross-section of the coarse mesh containing pores. The stress is applied at Area #1 while Area #3 is fixed in the x- and y-directions. The Area #2 denotes the artificially created pores to mimic the micro CT findings.
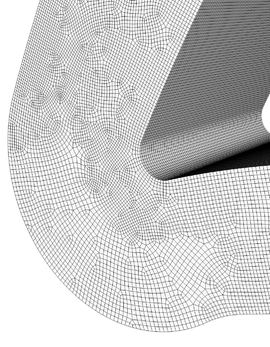
Figure 22: High fidelity meshes in the curved region of the model for both non-pore and pore cases - without pores
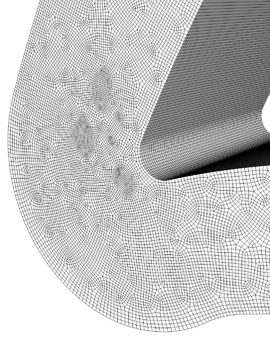
Figure 23: High fidelity meshes in the curved region of the model for both non-pore and pore cases - with pores
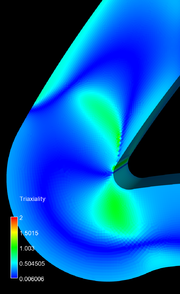
Figure 24: Clipped models showing - stress triaxiality without pores
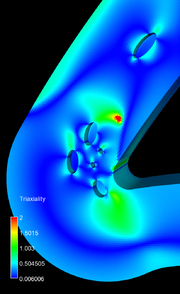
Figure 25: Clipped models showing - stress triaxiality with pores
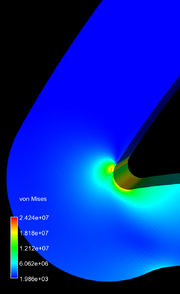
Figure 26: Clipped models showing - von Mises stress without pores
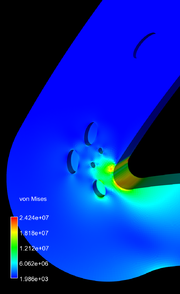
Figure 27: Clipped models showing - von Mises stress with pores
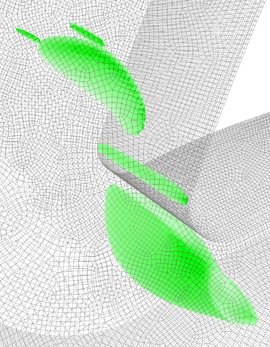
Figure 28: An isosurface of triaxiality for meshes - without pores
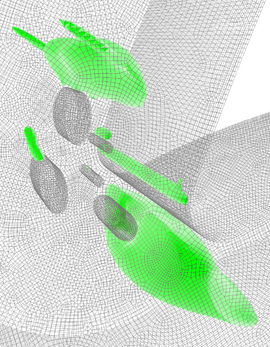
Figure 29: An isosurface of triaxiality for meshes - with pores
The isosurface is shown in green and represents a triaxiality value of 0.6.
Publication
Licensing
The figures of this page was reproduced with permission from Elsevier/Rights Link Order No. 501116679.