
Integrated Computational Materials Engineering (ICME)
Structure–Property Quantification of Corrosion Pitting Under Immersion and Salt-Spray Environments on an Extruded AZ61 Magnesium Alloy
Abstract
Extruded AZ61 magnesium coupons were exposed to immersion and cyclical salt
spray environments over 60 h in order to characterize their corrosion rates.
The characteristics of general corrosion, pitting corrosion, and intergranular
corrosion were quantified at various intervals. General corrosion was more
prevalent on the immersion surface. In addition, more pits formed on the
immersion surface due the continuous exposure to water and chloride ions.
However, the pits on the salt spray surface showed larger surface areas, larger
volumes, and covered more area on the micrographs as compared to the pits on
the immersion surface, due to the dried pit debris that trapped chloride ions
within the pits.[1]
Authors: Holly J. Martin, Mark F. Horstemeyer, Paul T. Wang
Experimental Methods (Methodology)
Twelve AZ61 coupons (2.54 x 2.54 cm x varying thicknesses) were cut from an extruded crash rail provided by Ford using a CNC Mill (Haas, Oxnard, CA). The coupon surfaces were left untreated, with no surface grinding or polishing, to test the corrosion effects on an extruded AZ61 magnesium alloy. Two different test environments were used in this study: salt spray testing and immersion. For salt spray testing, a Q-Fog CCT (Q-Panel Lab Products, Cleveland, OH) was used to cycle through three stages set at equal times, including a 3.5 wt.% NaCl spray at 35 °C, 100% humidity using distilled water at 35 °C, and a drying purge at 35 C. For immersion testing, an aquarium with an aeration unit was filled with 3.5 wt.% NaCl at room temperature. For both tests, the six coupons per test environment were hung at 20 degrees to the horizontal, as recommended by ASTM B-117. The coupons were exposed to the test environment for 1 h, removed, rinsed with distilled water to remove excess salt, and dried. Following the profilometer analysis, the coupons were then placed back into the test environment for an additional 3 h, an additional 8 h, an additional 24 h, and another 24 h. These times allowed for a longitudinal study to follow pit growth and surface changes over time, where t0 = 0, t1 = 1 h, t2 = 4 h, t3 = 12 h, t4 = 36 h, and t5 = 60 h. Between analyses and environmental exposures, the coupons were stored in a desiccator to ensure that no further surface reactions occurred. Following each time exposure, the coupons were analyzed using optical microscopy and laser profilometry. The coupons were weighed prior to testing and following each exposure on two different scales and an average was taken. Four thickness measurements were taken on each sample prior to and following the test. Because the coupons were cut from an engine cradle, the thicknesses of the coupons varied from side to side, meaning an average was taken per coupon based on the four measurements. Measurements for all figures were averaged from the data with error bars based on one standard deviation. Optical microscopy with an inverted light was used to take multiple images of the resulting surface at 5x magnification and 10x magnification (Axiovert 200 M Mat, Carl Zeiss Imaging Solutions, Thornwood, NY). The 5x magnification images were combined and then analyzed using the ImageAnalyzer (v. 2.1-2) provided by Mississippi State University to determine the number of pits, the pit surface area, the nearest neighbour radius, and the intergranular corrosion area fraction necessary for the development of a corrosion model not detailed in this paper but previously outlined by Horstemeyer et al. The 10x magnification was used to pictorially show the changes over the six cycles. Laser profilometry was used to scan a 1 mm by 1 mm area on two coupons per environment following each test cycle (Talysurf CLI 2000, Taylor Hobson Precision Ltd., Leicester, England). The resulting 2-D and 3-D images were used to document the changes in the pit characteristics due to the different test environments over the six cycles (Talymap Universal, v. 3.18, Taylor Hobson Precision Ltd., Leicester, England). Data was collected based on 14 pits within each 1 mm by 1 mm area, for a total of 28 data points per environment per cycle.
Results
Figs. 1 and 2 show the bulk changes in the coupons exposed to the two different corrosive environments. Because corrosion characteristics, such as pitting, may only slightly affect bulk changes, such as weight and thickness, other surface related phenomena were examined. Figs. 3–7 show the changes in individual pit characteristics of pit depth, pit surface area, and pit volume over the five exposure times for both the immersion environment and the salt spray environment, where Figs. 3–5 graphically compare the changes in pit depth, pit surface area, and pit volume, while Figs. 6 and 7 illustrate the changes in the pits over time. In addition to changes in individual pit characteristics, changes in the surface characteristics should also be scrutinized. Figs. 8–12 show the changes in surface characteristics, including pit number density, pit area, nearest neighbour distance, and intergranular corrosion area fraction (ICAF) as shown graphically in Figs. 8–11, while Figs. 12a and 12b show the changes in surface characteristics pictorially.
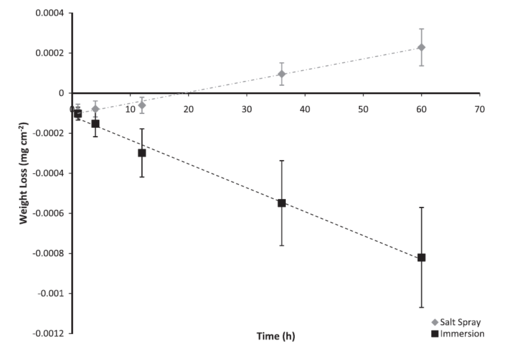
Figure 1: Average normalized weight loss of extruded AZ61 coupons based on test environment over 60 h (sample weight divided by 6.4516 cm2). The error bars were one standard deviation in each direction. Notice that the coupons exposed to the salt spray environment lost less weight, and actually gained weight due to the attachment of chloride ions. Note that both weight changing trends followed a linear behaviour.
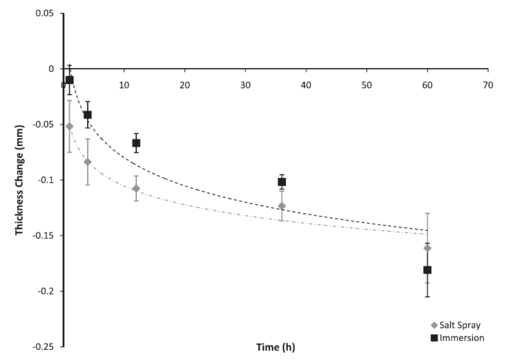
Figure 2: Average thickness loss of AZ61 coupons based on test environment over 60 h. The error bars were one standard deviation in each direction. Notice that the coupons exposed to the immersion environment lost less magnesium than the coupons exposed to the salt spray environment, although the thickness loss followed the same logarithmic trend.
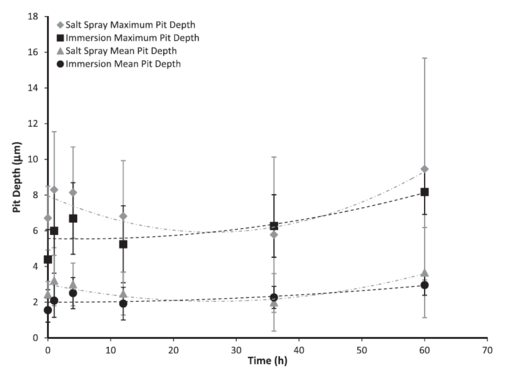
Figure 3: Maximum and mean pit depths based on test environment over 60 h. The error bars were one standard deviation in each direction. Notice that the maximum pit depth and the mean pit depth for the salt spray environment followed a second-order polynomial trend, where pit depth decreased to approximately 30 h before increasing to 60 h.
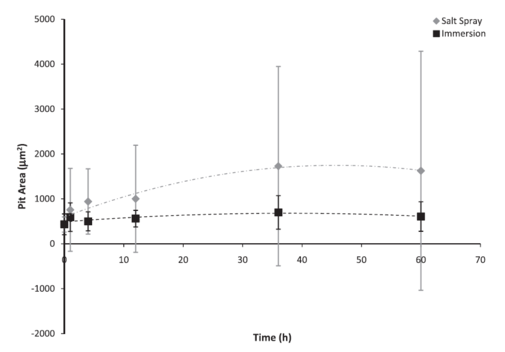
Figure 4: Individual pit surface area based on test environment over 60 h. The error bars were one standard deviation in each direction. Notice that the initial pit area for both environments was approximately the same. However, after the initial exposure, the pit area on the salt spray surfaces was larger. The salt spray surface followed a second order polynomial trend, which increased to approximately 48 h before decreasing to 60 h, while the immersion surface seemed to reach a saturation value.
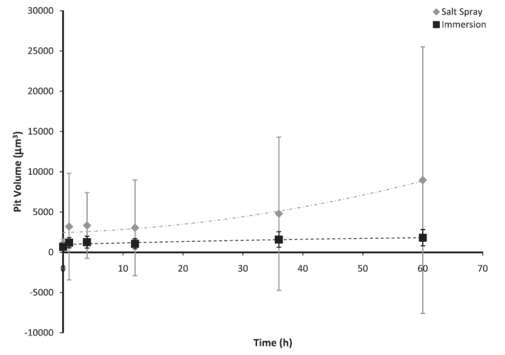
Figure 5: Individual pit volume based on test environment over 60 h. The error bars were one standard deviation in each direction. Notice that the initial pit volume was higher for the salt spray environment as compared to the immersion environment. The salt spray surface followed a second-order polynomial trend, although the volume mainly increased, while the immersion surface reached a saturation value.
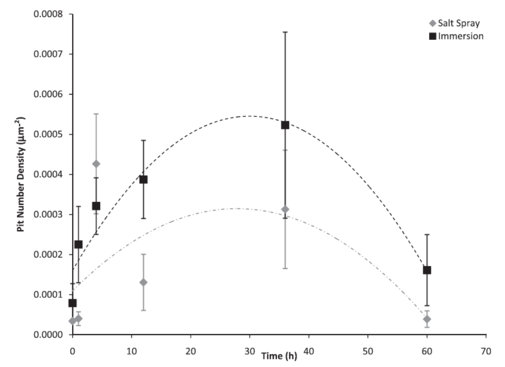
Figure 6: Pit number density based on test environment over 60 h. The error bars were one standard deviation in each direction. Notice that the initial number of pits on the surface was higher for the immersion environment as compared to the salt spray environment. The immersion surface followed a second-order polynomial trend, with the pit number density increasing until approximately 30 h. The salt spray surface also followed a second-order polynomial trend, with the pit number density increasing until approximately 26 h.
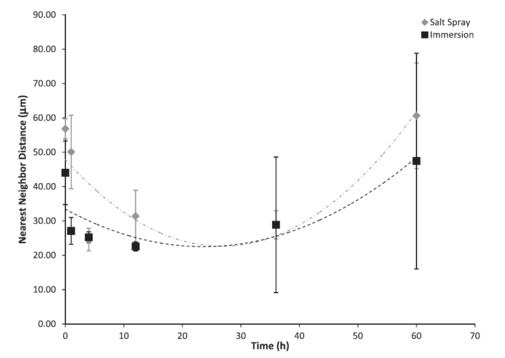
Figure 7: Nearest neighbour distance based on test environment over 60 h. The error bars were one standard deviation in each direction. Notice that the initial nearest neighbour distance on the surface was lower for the immersion environment as compared to the salt spray environment. Both the immersion surface and the salt spray surface followed second-order polynomial trends. The nearest neighbour distance decreased until approximately 29 h for the salt spray environment and approximately 19 h for the immersion environment before increasing.
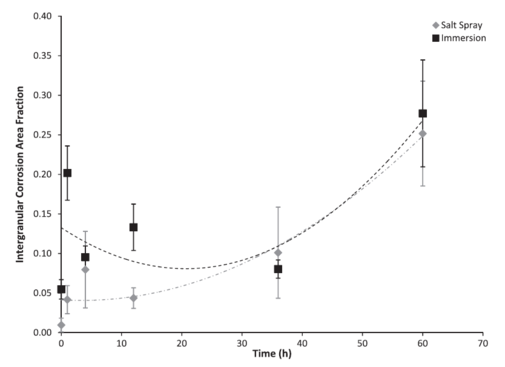
Figure 8: Intergranular corrosion area fraction based on test environment over 60 h. The error bars were one standard deviation in each direction. Notice that the initial intergranular corrosion area fraction on the surface was higher for the immersion environment as compared to the salt spray environment. Both the immersion surface and the salt spray surface followed second-order polynomial trends. The ICAF decreased until approximately 18 h for the salt spray environment and approximately 29 h for the immersion environment before increasing.
Figures 9 and 10 show the changes in individual pit characteristics in 2-D over 60 h for both the salt spray environment (Fig. 9) and the immersion environment (Fig. 10) using laser profilometry, while Figs. 11a and 11b show the changes in individual pit characteristics in 3-D. Both figures are arranged to show the changes between individual pits covering an area of 30 lm by 30 lm for each of the times examined, where t0 = 0, t1 = 1 h, t2 = 4 h, t3 = 12 h, t4 = 36 h, and t5 = 60 h. The colours displayed in the figure indicated distance from the lowest point within the pits, as shown by shades of blue and listed as zero in the legend, to the highest point, as shown by the pinks and reds. When looking at the salt spray surface, an initial increase in the number of pits was seen between t0 and t1. Between t1 and t2, the pits grew slightly while the surrounding surface remained. Following t3, the surrounding surface was gradually reduced while the pits began to connect, growing in area. For both t4 and t5, the pits grew in area, connecting with nearby pits, while the surrounding surface was left uncorroded. When looking at the immersion surface, one can see that the number of pits increased between t0 and t1, while the pits began to connect following t2. The pits then began to shrink in size and number following t3 with almost no difference in pit number or size appearing between t4 and t5.
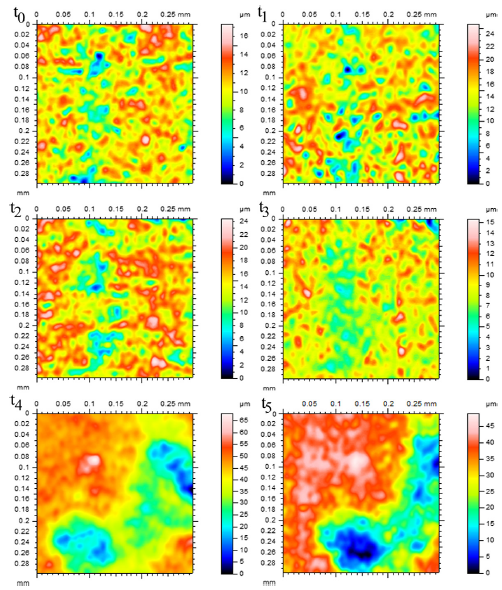
Figure 9: 2-D Laser Ppofilometry of the salt spray surface over 60 h. All spots were examined over a 30 x 30 lm area. Height measurements were made from the lowest point, shown as dark blue and listed as zero in the legend, to pink and red areas that indicate height. Notice that the number of pits initially grew for both surfaces from t0 to t1 (1 h), while the pits grew in area following t2 (4 h), increasing in size and connecting with neighbours, while the surrounding area was generally left uncorroded (For interpretation of the references to colour in this figure legend, the reader is referred to the web version of this article).
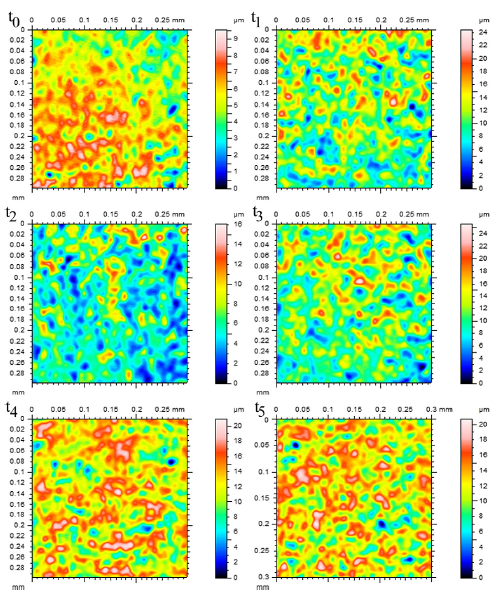
Figure 10: 2-D Laser profilometry of the immersion surface over 60 h. All spots were examined over a 30 x 30 lm area. Height measurements were made from the lowest point, shown as dark blue and listed as zero in the legend, to pink and red areas that indicate height. Notice that the number of pits initially grew in number from t0 to t1 (1 h), before connecting with neighbours following t2 (4 h). Following t2, the pits began shrinking in size before reaching an appearance that was similar for t4 (36 h) and t5 (60 h). (For interpretation of the references to colour in this figure legend, the reader is referred to the web version of this article.)
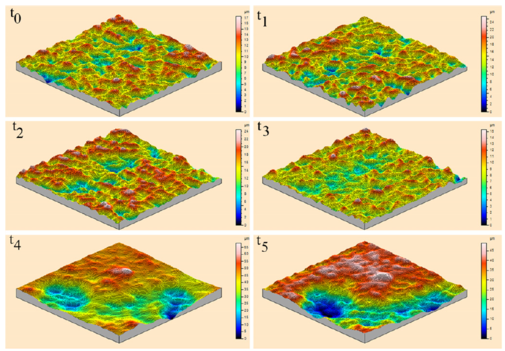
Figure 11a: 3-D Laser profilometry of the salt spray surface over 60 h. All spots were examined over a 30 x 30 lm area. Height measurements were made from the lowest point, shown as dark blue and listed as zero in the legend, to pink and red areas that indicate height. Notice that the number of pits initially grew for both surfaces from t0 to t1 (1 h), while the pits grew in area following t2 (4 h), increasing in size and connecting with neighbours, while the surrounding area was generally left uncorroded (For interpretation of the references to colour in this figure legend, the reader is referred to the web version of this article).
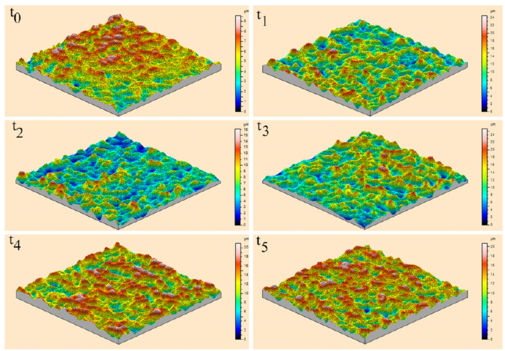
Figure 11b: 3-D Laser profilometry of the immersion surface over 60 h. All spots were examined over a 30 x 30 lm area. Height measurements were made from the lowest point, shown as dark blue and listed as zero in the legend, to pink and red areas that indicate height. Notice that the number of pits initially grew in number from t0 to t1 (1 h), before connecting with neighbours following t2 (4 h). Following t2, the pits began shrinking in size before reaching an appearance that was similar for t4 (36 h) and t5 (60 h) through t5. (For interpretation of the references to colour in this figure legend, the reader is referred to the web version of this article.)
Figures 12a and 12b show the changes in surface characteristics using micrographs over 60 h for both the salt spray environment (Fig. 12a) and the immersion environment (Fig. 12b). The figure is arranged to show the changes between the surfaces covering an area of 1 mm by 1 mm with scale bars of 500 lm for each of the times examined, where t0 = 0, t1 = 1 h, t2 = 4 h, t3 = 12 h, t4 = 36 h, and t5 = 60 h, and to show the differences in the pits between the salt spray (Fig. 12a) and the immersion (Fig. 12b) environments. The lines seen on both samples were the result of the extrusion process and were not added by grinding or polishing. Examining the salt spray surface, one can see a large number of pits present appearing between t0 and t1. The pits present following t1 then increase in size following t2 and t3 while more pits also appear during those exposures. Following t4, pit growth and coalescence is seen, as the pit corrosion expands across the surface.
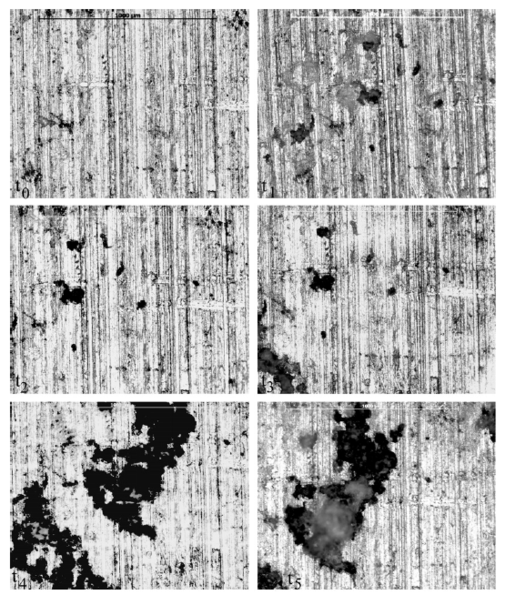
Figure 12a: Micrographs of the salt spray surface over 60 h. All spots were examined over a 1 x 1 mm area, with scale bars of 500 lm each. The darker areas indicate pit formation and coalescence, while the lighter areas indicate surfaces closer to the light and those affected by general corrosion. Notice that the pits grew in number through t3 (12 h), decreasing in number following t3. Also notice the pits grew in area through t5 (60 h). Also, the lines seen on the samples were the result of the extrusion process and were not a result of grinding or polishing.
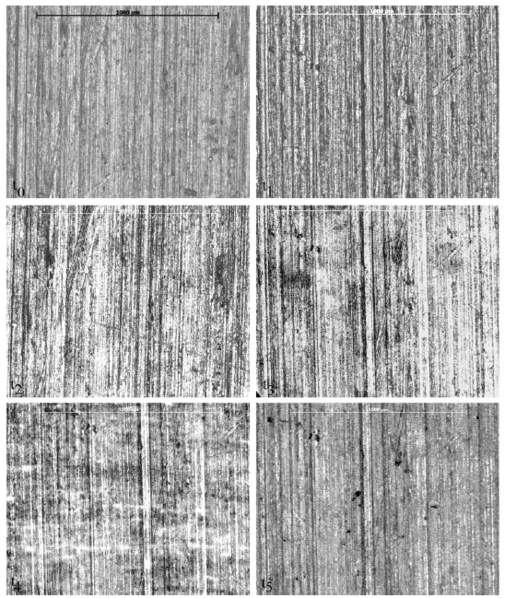
Figure 12b: Micrographs of the immersion surface over 60 h. All spots were examined over a 1 x 1 mm area, with scale bars of 500 lm each. The darker areas indicate pit formation and coalescence, while the lighter areas indicate surfaces closer to the light and those affected by general corrosion. Notice that the pits grew in number and area through t3 (12 h), while decreasing in number and size following t3. Also, the lines seen on the samples were the result of the extrusion process and were not a result of grinding or polishing.