
Integrated Computational Materials Engineering (ICME)
Quantification of Corrosion Mechanisms on an Extruded AZ31 Magnesium Alloy
Abstract
The corrosion mechanisms of pitting, intergranular, and general corrosion
were examined on an extruded AZ31 magnesium alloy subjected to immersion and
salt-spray environments. The three mechanisms were quantified using optical
microscopy and laser profilometry for over 60 hours of testing. Although both
environments showed similar trends, the immersion environment was more
deleterious with respect to intergranular and general corrosion. On the other
hand, the salt-spray environment did allow deeper pits to form throughout the
entirety of the experiments, which then led to a substantial thickness drop
(general corrosion) compared with the immersion environment.
[1]
Authors: Christopher A. Walton, Holly J. Martin, Mark F.
Horstemeyer, Paul T. Wang
Experimental Methods (Methodology)
For this study, twelve AZ31 coupons were cut from extruded sheet squares. The coupon surfaces were left untreated, with no surface grinding or polishing, to test the corrosion effects on an extruded AZ31 magnesium alloy. For the cyclic salt spray testing, a Q-Fog CCT was used to cycle through three stages set at equal times, including a 3.5 wt.% NaCl spray at 35 °C, 100% humidity using distilled water at 35 °C, and a drying purge at 35 °C. For immersion testing, an aquarium with an aeration unit was filled with 3.5 wt.% NaCl at room temperature. For both tests, the six coupons per test environment were hung at 20° to the horizontal, as recommended by ASTM B-117 [2]. The coupons were exposed to the test environment for 1 h, removed, rinsed with distilled water to remove excess salt, and dried in a dessicator. Following the profilometer analysis, the coupons were then placed back into the test environment for an additional 3 h, an additional 8 h, an additional 24 h, and another 24 h. These times allowed for a longitudinal study to follow pit growth and surface changes over time, where t0 = 0 h, t1 = 1 h, t2 = 4 h, t3 = 12 h, t4 = 36 h, and t5 = 60 h. Between analyses and environmental exposures, the coupons were stored in a desiccator to ensure that no further surface reactions occurred.
Results
This research focused on the differences in the corrosion mechanisms on an
extruded AZ31 magnesium alloy under two different environments: cyclical salt
spray and immersion. The corrosion mechanisms being examined at various times
were general corrosion, pitting corrosion, and intergranular corrosion.
The general corrosion rate with respect to weight (Figure 1) shows that the
specimens exposed to the immersion environment experienced a decrease in
weight. The continuous presence of water allowed the corrosion by-products to
dissolve and also keep the salt suspended. Conversely, the salt spray
environment coupons experienced an increase in weight. For this change, more
salt residuals or corrosion by-products are left on the surface than Mg(OH)2
being removed from the surfaces after drying. The general corrosion rate with
respect to thickness (Figure 2) was greater by approximately three times for
the salt spray when compared to the immersion surfaces, likely due to some
measurement error. The qualitative observations showed more pitting corrosion
along the edges of the salt spray coupons when compared to immersion coupons.
This increase in corrosion along the edges could lead to measurement
errors.
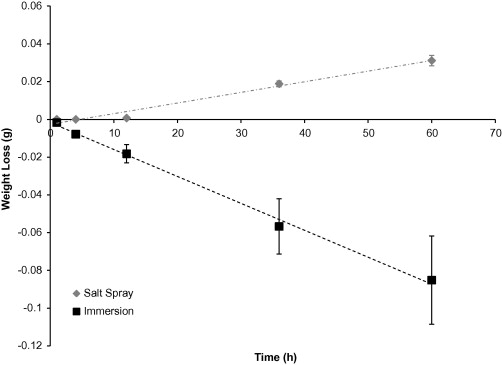
Figure 1: The average weight change of extruded AZ31 coupons based on a test environment over 60 hours. The error bars were one standard deviation in each direction. Notice that the coupons exposed to the salt spray environment not only did not lose weight but actually gained weight due to the attachment of chloride ions. Note that both weight changing trends followed a linear behaviour.
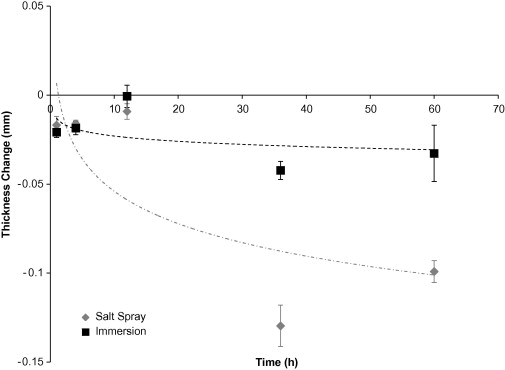
Figure 2. Average thickness loss of AZ31 coupons based on test environment over 60 hours. The error bars were one standard deviation in each direction. Notice that the coupons exposed to the immersion environment lost less magnesium than the coupons exposed to the salt spray environment, although the thickness loss followed the same logarithmic trend.
The pit surface area (Figure 3) and pit number density (Figure 4) rates were greater for the immersion surfaces than the salt spray surfaces, due to the continuous presence of water which allowed the pits to form and grow more easily.
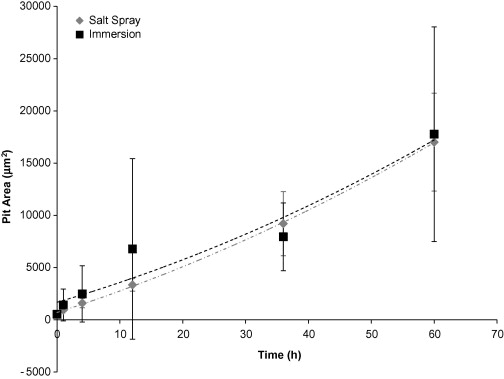
Figure 3. Individual pit surface area based on test environment over 60 hours. The error bars were one standard deviation in each direction. Notice that the initial pit area for both environments was approximately the same. However, after the initial exposure, the pit area on the immersion surfaces was larger. Both surfaces followed a slight second-order polynomial trend.
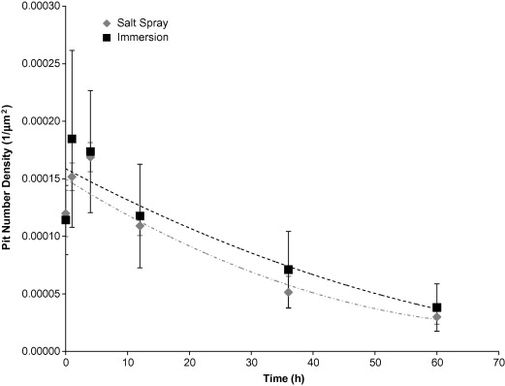
Figure 4. Pit Number Density based on test environment over 60 hours. The error bars were one standard deviation in each direction. Notice that the initial number of pits on the surface was higher for the immersion environment as compared to the salt spray environment. The pit number density for the immersion surface increased the first hour then began to decrease. The salt spray surface pit number density also increased until 4 hours and then began to decrease.
The nearest neighbour distance (Figure 5) of pits was higher for the salt spray environment than the immersion environment. The immersion surface had a lower nearest neighbour distance, because of the higher pit number density on the surfaces. The intergranular corrosion mechanism shows to dominate early in the immersion and salt spray environments. The intergranular corrosion area fraction (ICAF) rate shown in Figure 6 for the immersion environment was initially higher than the salt spray environment, but around 48 hours and on, the salt spray ICAF was higher.
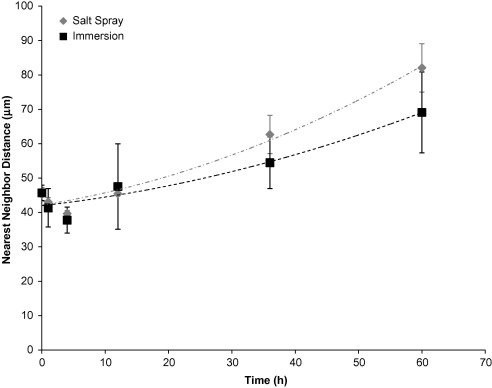
Figure 5. Nearest Neighbour Distance based on test environment over 60 hours. The error bars were one standard deviation in each direction. Notice that the initial nearest neighbour distance on the surface was about the same for the immersion and salt spray environments. Both the immersion surface and the salt spray surface followed second-order polynomial trends. The nearest neighbour distance decreased initially until about 4 hours before increasing.
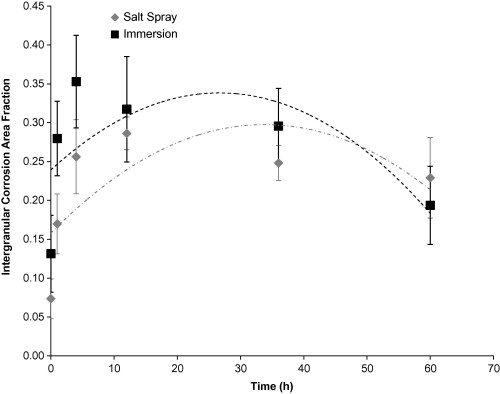
Figure 6. Intergranular Corrosion Area Fraction based on test environment over 60 hours. The error bars were one standard deviation in each direction. Notice that the initial intergranular corrosion area fraction on the surface was higher for the immersion environment as compared to the salt spray environment. Both the immersion surface and the salt spray surface followed second-order polynomial trends. The ICAF increased until approximately 35 hours for the salt spray environment and approximately 25 hours for the immersion environment before decreasing.
The pit and surface characteristics on the salt spray surfaces were affected by the cycling of the water, which did not continuously remove the pit debris, and encouraged the trapping of chloride ions, which allowed the pits to grow deeper and wider by the end of the 60 hours. Figure 7 shows that pits were trying to form around t2 but then become very noticeable around t3. By t4 and t5, larger pits have consumed most of the surface examined by the microscope. The micrographs in Figure 8 confirm that the immersion surface experienced a higher number of pits forming throughout the experiments. When comparing the micrographs (Figure 7 and 8) at t2, one can see that the immersion surface has darker areas, which indicate more pit areas than the salt-spray surface. Also, we notice larger pits forming at t3 on the immersion surface compared to t4 on the salt spray surfaces. Even as the pits coalesced, thereby increasing the distance between them, there were still more pits, so the distance between the pits would be less than the salt spray surface. The increase in distance between the pits on the immersion surface show that coalescence is not dominated by either pit number density or pit area, but instead is a function of both. [1][2]
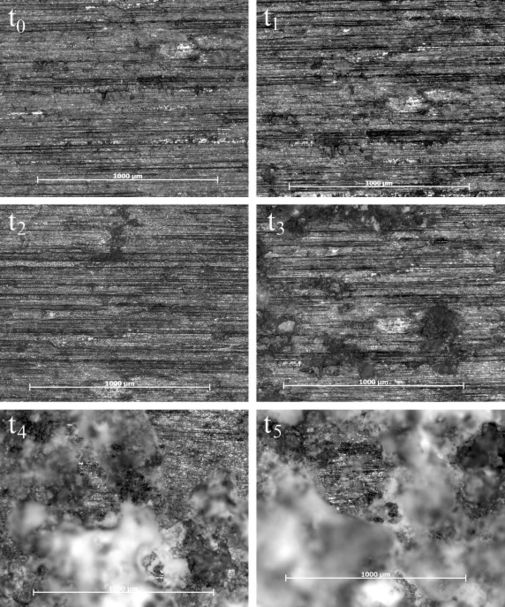
Figure 7. Micrographs of the salt spray surface over 60 hours. All spots were examined over a 1 mm x 1 mm area, with scale bars of 1000 µm each. The darker areas indicate pit formation and coalescence, while the lighter areas indicate surfaces closer to the light and those affected by general corrosion. Notice that the pits grew in number through t2 (4 h), decreasing in number following t2. Also, notice the pits grew in area through t5 (60 h).
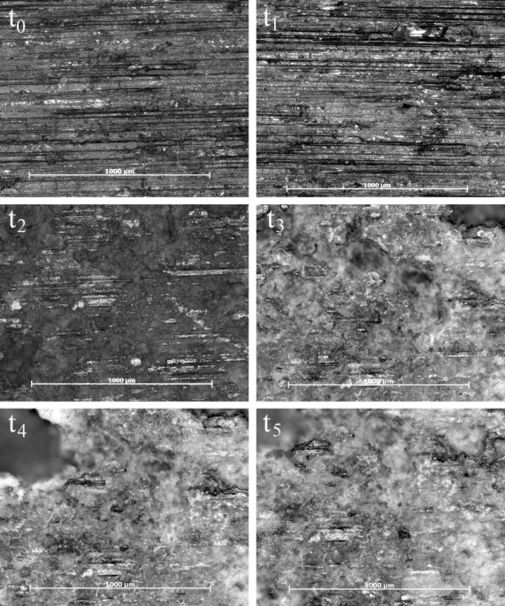
Figure 8. Micrographs of the immersion surface over 60 hours. All spots were examined over a 1 mm x 1 mm area, with scale bars of 1000 µm each. The darker areas indicate pit formation and coalescence, while the lighter areas indicate surfaces closer to the light and those affected by general corrosion. Notice that the pits grew in number and area through t1 (1 h), while decreasing in number following t1 but increasing in size and depth through t5.
Acknowledgements
Financial support from the Center for Advanced Vehicular Systems (CAVS) at Mississippi State University is gratefully acknowledged. This work was also supported by the Department of Energy and the National Energy Technology under Award Number No. DE-FC26-02OR22910.
References
1. C.A. Walton,
H.J. Martin, M.F. Horstemeyer, P.T. Wang. “Quantification of Corrosion
Mechanisms Under Immersion and Salt-Spray Environments on an Extruded AZ31
Magnesium Alloy.” Corrosion Science. 56 (2012) 194-208.
2. ASTM B117 – 07a (2007) Standard Practice for Operating Salt Spray (Fog)
Apparatus, Vol. 03.02, 2007.