
Integrated Computational Materials Engineering (ICME)
Corrosion Behaviour of Extruded AM30 Magnesium Alloy
Abstract
The mechanisms associated with general, pitting, and filiform corrosion were quantified at various intervals for extruded AM30 magnesium alloy exposed to a cyclical salt spray and immersion environment. The three mechanisms were quantified using optical microscopy, laser profilometry, and SEM coupled with EDX for over 60 h of testing. General corrosion and pitting corrosion were more severe in the immersion environment, and filiform corrosion was more severe in the salt-spray environment. The presence of a sodium ion (Na+) diffusion region around the edge of the corrosion pits functioned as cathodic sites, accelerating the localized pitting corrosion rates in immersion environment[1].
Experimental Methods (Methodology)
For this study, twelve AM30 coupons were cut from extruded sheet squares. The coupon surfaces were left untreated, with no surface grinding or polishing, to test the corrosion effects on an extruded AM30 magnesium alloy. For the cyclic salt spray testing, a Q-Fog CCT was used to cycle through three stages set at equal times, including a 3.5 wt.% NaCl spray at 35 °C, 100% humidity using distilled water at 35 °C, and a drying purge at 35 °C. For immersion testing, an aquarium with an aeration unit was filled with 3.5 wt.% NaCl at room temperature. For both tests, the six coupons per test environment were hung at 20° to the horizontal, as recommended by ASTM B-117[2]. The coupons were exposed to the test environment for 1 h, removed, rinsed with distilled water to remove excess salt, and dried in a dessicator. Following the profilometer analysis, the coupons were then placed back into the test environment for an additional 3 h, an additional 8 h, an additional 24 h, and another 24 h. These times allowed for a longitudinal study to follow pit growth and surface changes over time, where t0 = 0 h, t1 = 1 h, t2 = 4 h, t3 = 12 h, t4 = 36 h, and t5 = 60 h. Between analyses and environmental exposures, the coupons were stored in a desiccator to ensure that no further surface reactions occurred.
Results and Discussion
An extruded AM30 magnesium alloy was studied under two corrosion environments (cyclical salt spray and immersion) in order to observe the corrosion rates under different exposure environments. The coupons were examined at various times to determine the effect of three corrosion mechanisms: (1) general corrosion; (2) pitting corrosion in terms of the nucleation rate, growth rate, and coalescence rate; and (3) filiform corrosion.
General Corrosion
Figures 1 and 2 show the changes in weight and thickness as a function of time, respectively, for coupons in the salt spray environment and the immersion environment. The difference in weight and thickness for these two environments is caused by the difference in general corrosion rate, corrosion product formation, and dissolvability of the corrosion products.
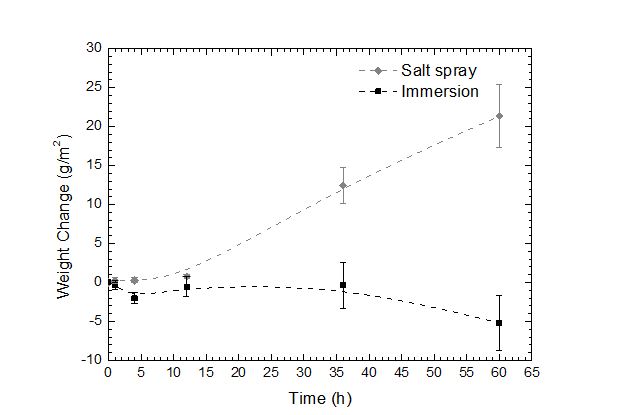
Figure 1: The average weight change of the extruded AM30 coupons based on a test environment over 60 hours. The error bars were one standard deviation in each direction. The coupons exposed to the salt spray environment gained weight throughout the experimental time due to corrosion product residuals. The coupons exposed to the immersion environment lost weight gradually throughout the experimental time.
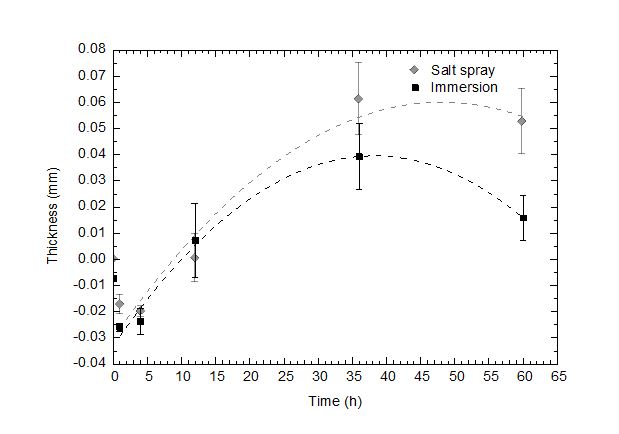
Figure 2: The average thickness change of AM30 coupons based on test environment over 60 hours. The error bars were one standard deviation in each direction. Notice that before 12 h, both tests initially experienced a thickness loss. However, after 12 hours, the coupons exposed to both environments started to gain thickness because of the corrosion product residuals remaining on the specimens. After 36 hours, coupons exposed to the both environments began losing thickness until 60 hours.
Pit Nucleation
Figure 3 shows the change in the pit number density over time, which is the number of pits per unit area, for both the salt spray environment and the immersion environment. The pit number density is a quantitative value for the pit nucleation rate. The pit number density for the salt spray environment decreased to 36 h, after which an increase was detected. For the immersion environment, the pit number density initially increased to 12 h, then decreased to 36 h, after which an increase was observed.
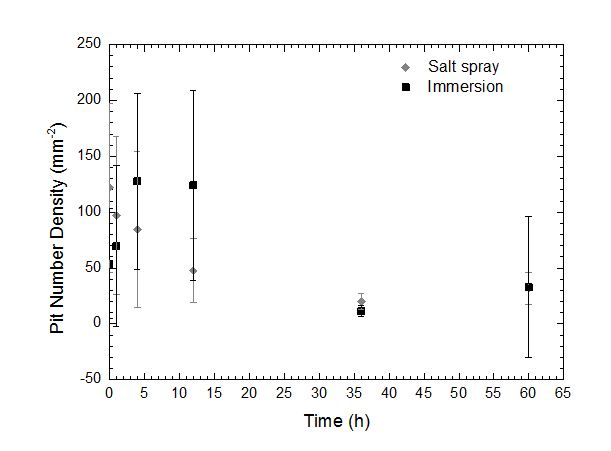
Figure 3: Pit Number Density based on test environment over 60 hours. The error bars were one standard deviation in each direction. Notice that the pit number density on the salt spray surface experienced a decrease until 36 hours, after which it increased to 60 hours. The pit number density on the immersion surface increased to 12 hours, then decreased until 36 hours, after which it increased to 60 hours.
Pit Growth
Figures 4-6 show the changes in the in-plane pit area and the individual pit characteristics of pit depth and pit volume, respectively, as a function of exposure time for both the salt spray environment and the immersion environment.The pit growth rate was characterised by in-plane pit area, pit depth, and pit volume growth rate, and it was greater in the immersion environment prior to 36 h but was greater in the salt spray environment after 36 h. The higher pit growth rate for the immersion environments was caused by the poor protective oxide film, and the formation of strong cathodic and anodic sites in the corrosion pits. The higher pit growth rate for the salt spray environment following 36 h was caused by the rupture of oxide film and the relatively weak general corrosion on the surface.
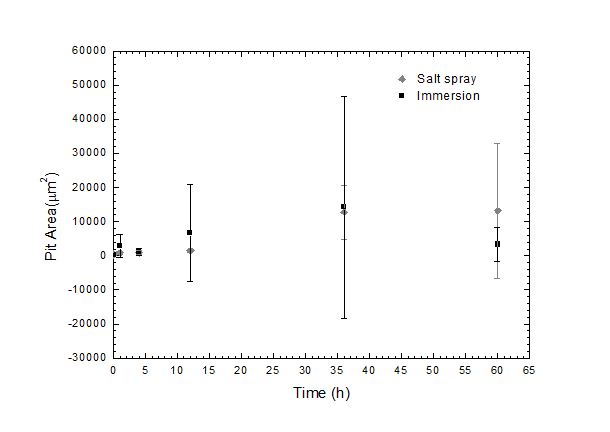
Figure 4: In-plane pit area based on test environment over 60 hours. The error bars were one standard deviation in each direction. Notice that the initial in-plane pit area for both environments was approximately the same. The in-plane pit area for the salt spray environment increased slightly over the entire exposure periods. The in-plane pit area for the immersion environment initially increased to 36 h; after 36 h, the in-plane pit area decreased to 60 h.
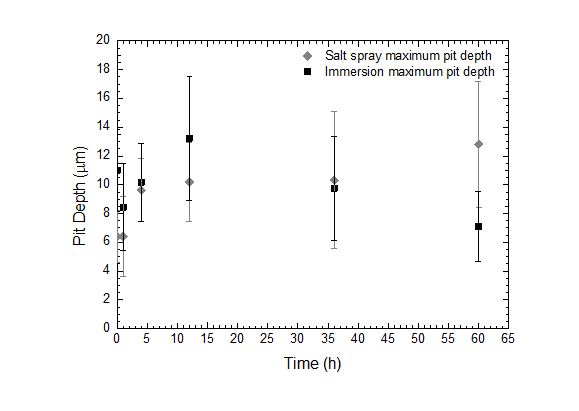
Figure 5: Maximum pit depths based on test environment over 60 hours. The error bars were one standard deviation in each direction. Notice that the maximum pit depth for the salt spray environment experienced a slight increase to 60 hours. The maximum pit depth for the immersion environment experienced a decrease at the very beginning 1hour, then it increased to 12 hours before decreasing to 60 hours.
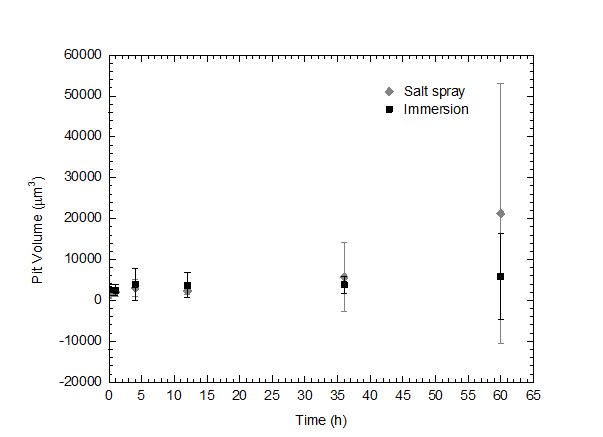
Figure 6: Individual pit volume based on test environment over 60 hours. The error bars were one standard deviation in each direction. Notice that the initial pit volume was approximately the same for both the salt spray environment and the immersion environment. The pit volume for the salt spray environment increased throughout the entire experimental exposure. The pit volume for the immersion environment remained mostly constant over the entire experimental exposure.
Pit Coalescence
The pit coalescence rate is related to the nearest neighbour distance between pits. For the salt spray environment, the pit coalescence rate is greater in the initial 36 h than the time period between t4 and t5. This trend arose because the relative protective corrosion layer prevented pit nucleation on the surface, as well as only allowing nearby corrosion pits to grow into each other. Pit coalescence on immersion samples arose at t2, because the continual access to the aggressive electrolytes allowed the pits to grow faster than the effects of general corrosion. The pits then coalesced with each other after reaching a certain size.
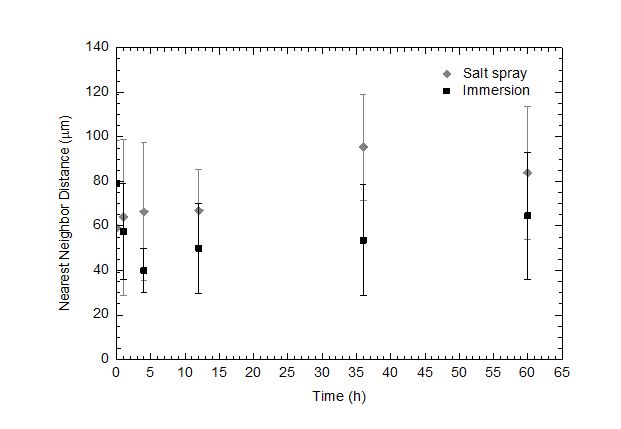
Figure 7: Nearest Neighbour Distance based on test environment over 60 hours. The error bars were one standard deviation in each direction. Notice that the nearest neighbour distance for the salt spray surface increased to 36 h before decreasing to 60 h. The nearest neighbour distance for the immersion environment decreased to 4 h before increasing to 60 h.
Filiform Corrosion
As shown by Figure 8, filiform corrosion is higher for the salt spray environment, because the difference in the experimental set-up resulted in a difference in cathodic reactions in the two environments. For both environments, the occurrence of filiform corrosion might be also related to the chemical heterogeneity of the aluminium content between different areas on the surface of the material.
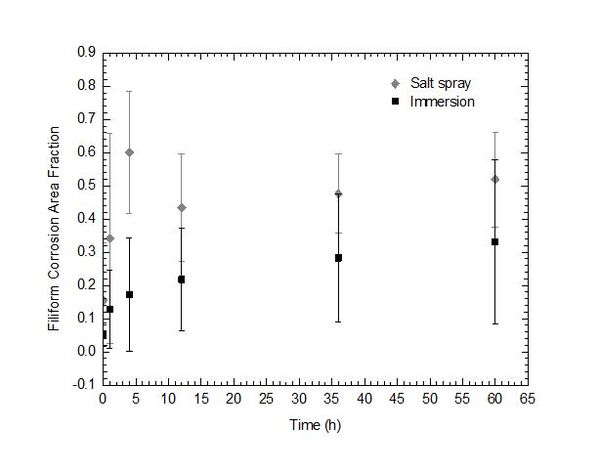
Figure 8: Filiform Corrosion Area Fraction (FCAF) based on test environment over 60 hours. The error bars were one standard deviation in each direction. The FCAF on the salt spray surfaces initially experienced an increase to 4 h, then decreased to 12 h, after which it increased until 60 h. The FCAF on the immersion environment increased throughout the experimental period. The FCAF on the salt spray environment was slightly higher than the immersion environment.
Acknowledgements
Financial support from the Center for Advanced Vehicular Systems (CAVS) at Mississippi State University is gratefully acknowledged. This work was also supported by the Department of Energy and the National Energy Technology Laboratory under Award No. DEFC26- 02OR22910.
References
1. W. Song, H.J. Martin, A. Hicks, D. Seely, C.A. Walton, W.B. Lawrimore II,
P.T. Wang, M.F. Horstemeyer, “Corrosion behaviour of extruded AM30 magnesium
alloy under salt-spray and immersion environments”, Corrosion Science,78 (2014)
353-368.
2. ASTM B117 – 07a (2007) Standard Practice for Operating Salt Spray (Fog)
Apparatus, Vol. 03.02, 2007.