
Integrated Computational Materials Engineering (ICME)
Comparison of Corrosion Pitting Under Immersion and Salt-Spray Environments on an As-Cast AE44 Magnesium Alloy
Abstract
The corrosion mechanisms of pitting, intergranular corrosion, and general
corrosion were examined on an AE44 magnesium alloy subjected to immersion and
salt-spray environments. The two environments show similar trends with respect
to weight loss and thickness loss, although the immersion environment induces
greater amounts of weight loss of magnesium. With respect to the corrosion
mechanisms, the two environments show definitive trends, owing to the
continuous presence of water in the immersion environment allowing more and
larger pits to form as compared to the salt-spray environment. The immersion
environment was more deleterious than the salt-spray environment for
magnesium.[1]
Authors: Holly J. Martin, Mark F. Horstemeyer, Paul T. Wang
Experimental Methods (Methodology)
Twelve AE44 coupons (2.54 cm x 2.54 cm x varying thicknesses) were cut from an as-received engine cradle provided by Meridian Technologies using a vertical band saw (MSC Industrial Supply Company, Columbus, MS). The coupon surfaces, with the chemical composition of the AE44 magnesium alloys shown in Table 1, were left untreated, to test the corrosion effects on an as-cast AE44 magnesium alloy. Two different test environments were used in this study: salt-spray testing and immersion. For salt-spray testing, a Q-Fog CCT (Q-Panel Lab Products, Cleveland, OH) was used to cycle through three stages set at equal times, including a 3.5 wt.% NaCl spray at 35C, 100% humidity using distilled water at 35C, and a drying purge at 35C. For immersion testing, an aquarium with an aeration unit was filled with 3.5 wt.% NaCl at room temperature. For both tests, the six coupons per test environment were hung at 20 degrees to the horizontal, as recommended by ASTM B-117. The coupons were exposed to the test environment for 1 h, removed, rinsed with distilled water to remove excess salt, and dried. Following analysis, the coupons were then placed back into the test environment for an additional 3 h, an additional 8 h, an additional 24 h, and another 24 h. These times allowed for a longitudinal study to follow pit growth and surface changes over time, where t0 = 0, t1 = 1 h, t2 = 4 h, t3 = 12 h, t4 = 36 h, and t5 = 60 h. Between analyses and environmental exposures, the coupons were stored in a desiccator to ensure that no further surface reactions occurred. Following each time exposure, the coupons were analyzed using optical microscopy and laser profilometry. The coupons were weighed prior to testing and following each exposure on two different scales and an average was taken. Four thickness measurements were taken on each sample prior to and following the test. Because the coupons were cut from an engine cradle, the thicknesses of the coupons varied from side to side, meaning an average was taken per coupon based on the four measurements. Measurements for all figures were averages from the data with error bars based on one standard deviation. Optical microscopy with an inverted light was used to take multiple images of the resulting surface at 5x magnification and 10x magnification (Axiovert 200M Mat, Carl Zeiss Imaging Solutions, Thornwood, NY). The 5x magnification images were combined and then analyzed using the ImageAnalyzer (v. 2.1–2) provided by Mississippi State University to determine the number of pits, the pit surface area, the nearest neighbour radius, and the intergranular corrosion area fraction necessary for the development of a corrosion model not detailed in this paper but previously outlined by Horstemeyer et al. [25]. The 10x magnification was used to pictorially show the changes over the six cycles. Laser profilometry was used to scan a 1 mm x 1 mm area on each coupon following each test cycle (Talysurf CLI 2000, Taylor Hobson Precision Ltd., Leicester, England). The resulting 2-D and 3-D images were used to document the changes in the pit characteristics due to the different test environments over the six cycles (Talymap Universal, v. 3.18, Taylor Hobson Precision Ltd., Leicester, England).
Results
Figs. 1 and 2 show the bulk changes in the coupons exposed to the two
different corrosive environments. Because corrosion characteristics, such as
pitting, may only slightly affect bulk changes, such as weight and thickness,
other surface related phenomena must be examined. Figs. 3–5, 6a, 6b, 7a and 7b
show the changes in individual pit characteristics of pit depth, pit surface
area, and pit volume over the five exposure times for both the immersion
environment and the salt-spray environment, where Figs. 3–5 graphically compare
the changes in pit depth, pit surface area, and pit volume, while Figs. 6a, 6b,
7a and 7b illustrate the changes in the pits over time. In addition to changes
in individual pit characteristics, changes in the surface characteristics
should also be scrutinized.
Figs. 1 and 2 show the average weight loss and thickness loss, respectively,
over the five exposure times for both the immersion environment and the
salt-spray environment. As one can see, the samples follow the same logarithmic
trend in weight loss (Fig. 1) and thickness loss (Fig. 2), although the
immersion samples lost approximately 80% more weight and approximately 28% more
thickness as compared to the salt-spray samples.
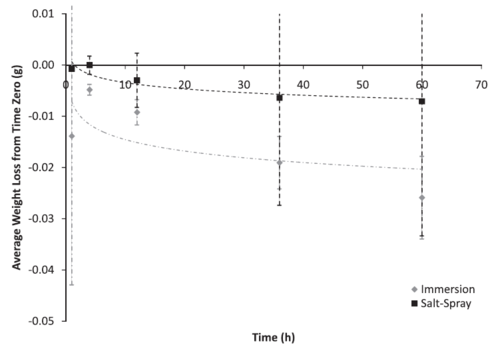
Figure 1: Average weight loss of AE44 coupons based on test environment over 60 h. The error bars are one standard deviation in each direction. Notice that the coupons exposed to the salt-spray environment lost less weight than the coupons exposed to the immersion environment, although the weight loss follows the same logarithmic trend.
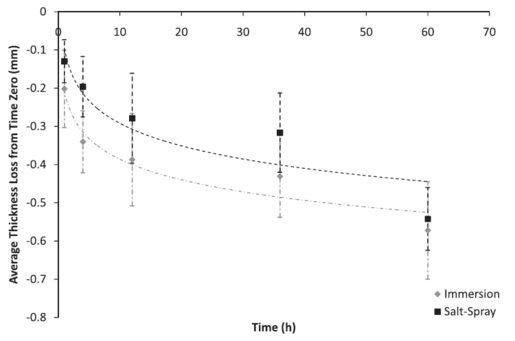
Figure 2: Average thickness loss of AE44 coupons based on test environment over 60 h. The error bars are one standard deviation in each direction. Notice that the coupons exposed to the salt-spray environment lost less magnesium than the coupons exposed to the immersion environment, although the thickness loss follows the same logarithmic trend.
Fig. 3 shows the changes in both the maximum pit depth and mean pit depth over 60 h. As one can see, the mean pit depth for both environments follow the same second-order polynomial trend as the maximum pit depth, although the trend for the maximum pit depth is stronger than the mean pit depth. The pit depth for the immersion surface starts at the highest point, before gradually decreasing until 60 h was reached. The pit depth initially increases until approximately 30 h, after which the pit depth decreases until 60 h was reach. At the end of t5 (60 h), the pit depth for the immersion environment is less than the pit depth following 1 h (t1), while the pit depth for the salt-spray environment at 60 h is about equal to the pit depth following 1 h. Fig. 4 shows the changes in the individual pit area over 60 h for both the immersion environment and the salt-spray environment. The individual pit area for both the immersion environment and the salt-spray environment follows second-order polynomial trends. For the immersion environment, the pit area initially increases until approximately 32 h before decreasing, with a final value at 60 h less than the pit area at 1 h. For the salt-spray environment, the pit area initially decreases until approximately 32 h, after which the pit area stays approximately equal to the pit area of 32 h.
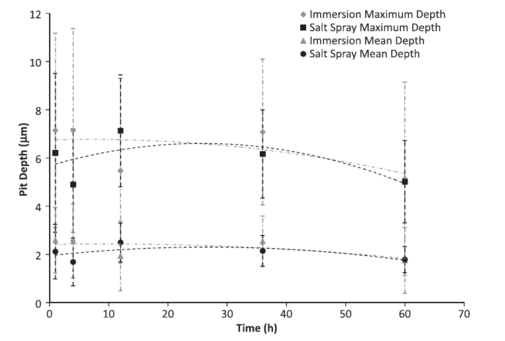
Figure 3: Maximum and mean pit depths based on test environment over 60 h. The error bars are one standard deviation in each direction. Notice that the maximum pit depth and the mean pit depth for both environments is approximately the same. Given the high uncertainty bands, the trends are unclear.
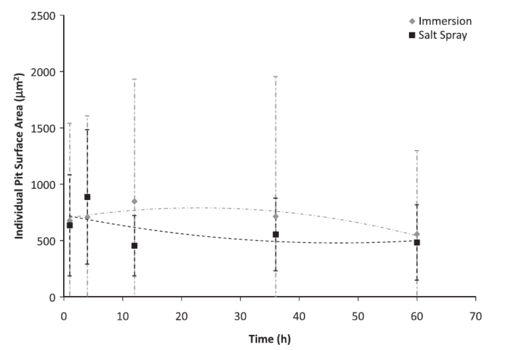
Figure 4: Individual pit area based on test environment over 60 h. The error bars are one standard deviation in each direction. Notice that the initial pit area for both environments is approximately the same. However, after the initial exposure, the pit area on the immersion surfaces is larger. The immersion surface follows a second-order polynomial trend, which increased to approximately 27 h before decreasing to 60 h, while the salt-spray seems to reach a saturation value at 32 h.
Fig. 5 shows the changes in the individual pit volume over 60 h for both the immersion environment and the salt-spray environment. The pit volume for both the immersion environment and the salt-spray environment follows slight second-order polynomial trends. For both environments, the pit volume decreases over time, resulting in pit volumes that are smaller at 60 h than at 1 h.
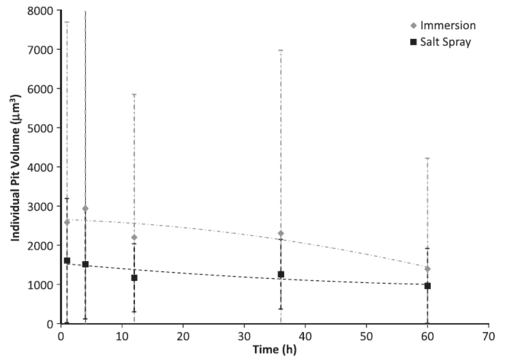
Figure 5: Individual pit volume based on test environment over 60 h. The error bars are one standard deviation in each direction. Notice that the initial pit volume is higher for the immersion environment as compared to the salt-spray environment. The immersion surface follows a second-order polynomial trend, although the volume mainly decreases, while the salt-spray surface reaches a saturation value.
Figs. 6a and 6b show the changes in individual pit characteristics in 2-D over 60 h for both the salt-spray environment (Fig. 6a) and the immersion environment (Fig. 6b) using laser profilometry, while Figs. 7a and 7b show the changes in individual pit characteristics in 3-D. Both figures are arranged to show the changes between individual pits covering an area of 75 lm by 75lm for each of the times examined, where t0 = 0, t1 = 1 h, t2 = 4 h, t3 = 12 h, t4 = 36 h, and t5 = 60 h, and to show the differences in the pits between the salt-spray (Figs. 6a and 7a) and the immersion (Figs. 6b and 7b) environments. The colours displayed in the figure indicated depth, as shown by the shades of blue, and height, as shown by the pinks and reds. When comparing t0 to t1, one can see that the pits, and surrounding areas, initially grow, as pitting corrosion is the dominant mechanism. Between t1 and t2, general corrosion and intergranular corrosion are dominant, as the pits and peaks shrink indicating general corrosion, while the green area, indicating intergranular corrosion, increases. When comparing t2 and t3, general corrosion is still dominant, as the pits, peaks, and intergranular area connecting the peaks are all reduced. At t4, pitting corrosion again becomes dominant, as the pit size and peak height increases, showing general corrosion is not removing magnesium surrounding the pits or from the top of the peaks. Pitting corrosion is still dominant at t5, as the pits are increasing in depth while the peaks are increasing in height.
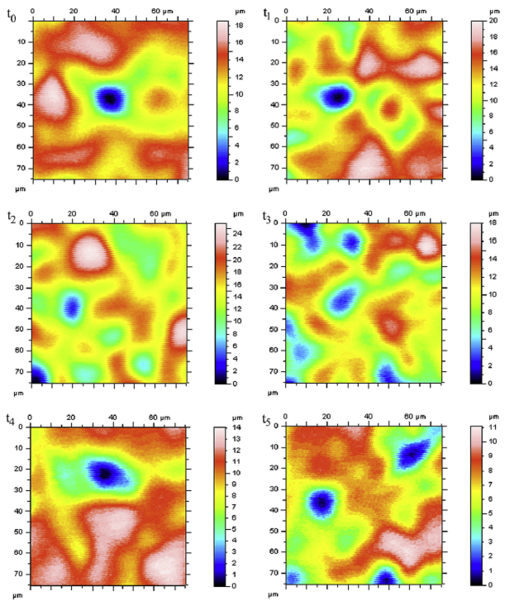
Figure 6a: 2-D laser profilometry of the salt-spray surface over 60 h. All spots were examined over a 75 lm x 75 lm area. The dark blue indicates depth, while the reds and pink indicate height. Notice that the pits initially grow for both surfaces from t0 to t1, before shrinking in size, but not depth, at t2. Following the pit reduction, the pits begin growing again at t4 and continue to grow through t5.
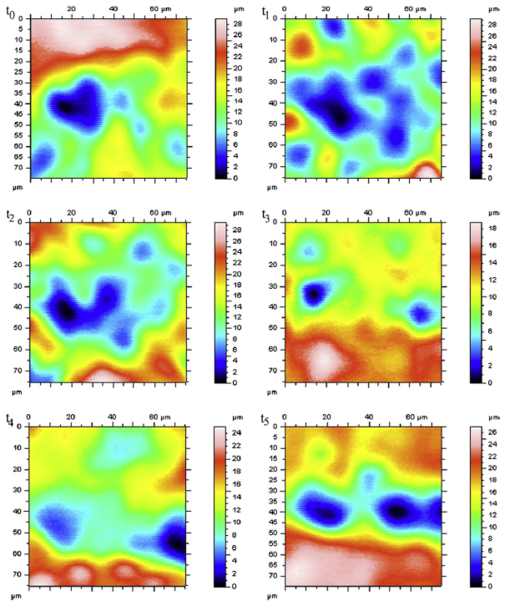
Figure 6b: 2-D laser profilometry of the immersion surface over 60 h. All spots were examined over a 75 lm x 75 lm area. The dark blue indicates depth, while the reds and pink indicate height. Notice that the pits initially grow for both surfaces from t0 to t1, before shrinking in size, but not depth, at t2. Following the pit reduction, the pits begin growing again at t4 and continue to grow through t5.
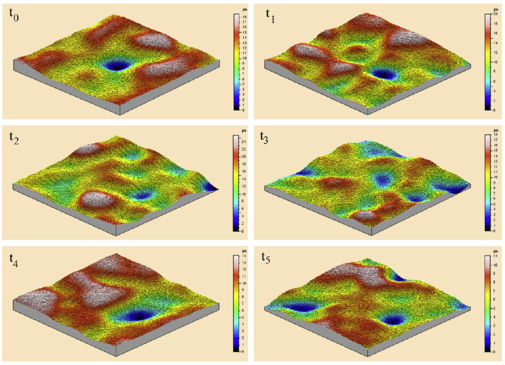
Figure 7a: 3-D laser profilometry of the salt-spray surface over 60 h. All spots were examined over a 75 lm x 75 lm area. The dark blue indicates depth, while the reds and pink indicate height. Notice that the pits initially grow for both surfaces from t0 to t1, before shrinking in size, but not depth, at t2. Following the pit reduction, the pits begin growing again at t4 and continue to grow through t5.
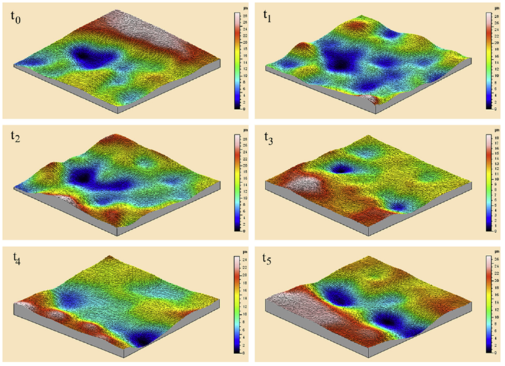
Figure 7b: 3-D laser profilometry of the immersion surface over 60 h. All spots were examined over a 75 lm x 75 lm area. The dark blue indicates depth, while the reds and pink indicate height. Notice that the pits initially grow for both surfaces from t0 to t1, before shrinking in size, but not depth, at t2. Following the pit reduction, the pits begin growing again at t4 and continue to grow through t5.
Acknowledgements
Financial support from the Center for Advanced Vehicular Systems (CAVS) at Mississippi State University is gratefully acknowledged. Support from Meridian Technologies, which provided the AE44 Mg engine cradle, is also deeply appreciated.
References
1. [Martin, H. J.; Horstemeyer, M. F.; Wang, P. T. Martin, H. J.; Horstemeyer, M. F.; Wang, P. T. Comparison of corrosion pitting under immersion and salt-spray environments on an as-cast AE44 magnesium alloy. Corrosion Science 2010, 52 (11), 3624–3638 DOI: 10.1016/j.corsci.2010.07.009.]