
Integrated Computational Materials Engineering (ICME)
Rabbit Patellar Tendon
Abstract
The ultrastructural mechanism for strain rate sensitivity of collagenous tissue has not been well studied at the collagen fibril level. Our objective is to reveal the mechanistic contribution of tendon’s key structural component to strain rate sensitivity. We have investigated the structure of the collagen fibril undergoing tension at different strain rates. Tendon fascicles were pulled and fixed within the linear region (12% local tissue strain) at multiple strain rates. Although samples were pulled to the same percent elongation, the fibrils were noticed to elongate differently, increasing with strain rate. For the 0.1, 10, and 70%/s strain rates, there were 1.84+-3.6%, 5.5+-1.9%, and 7.03+-2.2% elongations (mean+-S.D.), respectively. We concluded that the collagen fibrils underwent significantly greater recruitment (fibril strain relative to global tissue strain) at higher strain rates. A better understanding of tendon mechanisms at lower hierarchical levels would help establish a basis for future development of constitutive models and assist in tissue replacement design.
Methods
Three mature Japanese white rabbits were used for this study. Three tendons,
all from different animals, were used in the study for interrupted mechanical
testing and SEM analysis. The remaining patellar tendon samples were used for
mechanical testing only. Both the proximal and distal insertion portions of the
patellar tendon and the fascia surrounding the tendon were removed. The middle
portion of the tendon was carefully extracted and then trimmed into four
fascicles with the patella end attached to a holder and the other end grasped
tightly with forceps (cut with an approximate width of 1mm (Yamamoto, 1999)).
All fascicles used in the study were cut from the inner portions (the central
4mm) of the tendon to prevent location variability within the tendon (Williams
et al.,2008). One tendon from each animal yielded 4 fascicles (extracted from
the inner portion of tendon), among which 3 fascicles were used for tensile
testing and 1 was used as a control sample.
Tendon fascicles were mounted onto the Biomomentum Mach-1 mechanical testing
system (Biomomentum Inc.,Canada). Special grips were designed to secure the
specimen and minimize slippage. All tested fascicles had grips initially at 7mm
apart giving a ratio of the samples’ dimensions to be around 7:1(length
vs.width), with each sample slightly varying in diameter. The fascicles were
preconditioned in order to provide the specimens with similar loading histories
and reduce variations in response to loading. Each sample was preloaded at 0.01
N at 0.01 mm/s; and zero strain (gauge length) was defined at this load. Each
specimen was then preconditioned to a strain of 2%, for 10 cycles at 1 Hz
(Yamamoto, 1999). The mechanical data were recorded in engineering stress and
engineering strain. Control samples were subjected to the same preconditioning
protocol and then fixed at a zero load in the fixative bath for the same amount
of time (4 h). For the 4 fascicles yielded from each tendon, one was used as
load free control and three were loaded to 20% clamp-to-clamp strain at 0.1,
10, and 70%/s strain rates. This corresponded to a 12% local strain in the
midsubstance. Immediately after the test, the tendon was fixed in 1.25%
glutaraldehyde for 4 h. The tangent modulus was taken from the linear portion
of the curve at approximately 5% strain. Because of the inhomogeneous nature of
tissue strain field from clamp-to-clamp, we monitored the local strain of
midsubstance by placing two markers using permanent ink vertically on the
fascicle surface and imaging the marker movement before and after the
elongation. The local strain was calculated by measuring the distances between
the centroids of two markers.
Samples for SEM were fixed in 1.25% glutaraldehyde in 0.1 M phosphate buffer
(pH 7.2), rinsed with 0.1 M phosphate buffer, and post-fixed with 2% osmium
tetraoxide in 0.1 M phosphate buffer. Samples were dehydrated in a graded
ethanol series and then were critical point dried in a Polaron E 3000 CPD. They
were then mounted on aluminum stubs and sputter coated with gold–palladium.
Specimens were imaged using a JEOL JSM-6500 FE scanning electron
microscope.
After imaging,the samples were analyzed using Image J software (Image J
1.41,National Institutes of Health, USA).
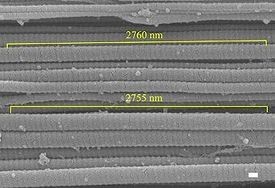
Fig. 1. Image analysis for 2 fibrils after a 70%/s test.SEM image shows 50 D-periods measuring 2755 and 2760 nm(correlating to a 55.1 and 55.2 nm D-period, respectively). Scale bar=100 nm.
SEM photographs were taken from x20,000 to x30,000 magnification. The average number of D-periods for each fibril (40+-9) was averaged by Image J using the image’s scale bar and a scale factor calculated by SF=(distance in pixels)/(known distance (nm)).The elongation of collagen fibrils were compared among different strain rates to show the differences in fibril recruitment. Note that,in this study, fibril recruitment was defined as the amount of fibril strain relative to the global tissue strain. For each interruption tensile test, five images randomly located in the specimen’s midsubstance were used to measure the fibril periodicity(Fig. 1). However, in order to avoid stereological bias, the imaging areas needed to have collagen fibrils predominately aligned along the image plane. Obviously, collagen fibrils with a large oblique orientation (out of plane)could potentially underestimate the D-period. Six fibrils from each image were selected for D-period measurement. Again, collagen fibrils within plane orientation were picked for an accurate measurement. The sample size was 90 fibrils for each strain rate, while the total number of fibrils analyzed for the control group was 50. This was due to the crimping nature of load free tendon and the difficulty of locating in-plane undistorted fibrils.
Results
The stress–strain curves showed strain rate sensitivity of tendon fascicles
(Fig. 2). Strain rate sensitivity was verified by an increase in tangent
modulus with a strain rate increase. The tangent moduli in the linear region
were found to have values of 102+-42, 195+-58, and 251+-116 MPa for 0.1, 10,
and 70%/s, respectively (Fig. 3). Tangent modulus values were found to be
significantly different using post-hoc pair-wise comparisons vs. the
quasistatic rate (p=0.05). There was no difference found between 10 and 70%/s
strain rates(p=0.32) although there was an increase in trend.
The fixed fascicles were found to maintain their elongation after the removal
of the tendon from the grips. SEM images showed a straightening of fibrils in
strained fascicles compared with the less orderly control samples (Fig. 4).
Elongation of the D-period was found to increase with strain rate increase
(Fig. 5). For the control, 0.1, 10, and 70%/s fascicles, the average D-period
lengths were found to be 51.3+-1.4, 52.2+-1.9, 54.1+-1.0, and 54.9+-1.2 nm,
respectively. Statistical analysis found that all strain rates to be
statistically significant from the control (p<0.005). Each rate was also
compared with each other and also was found to be significant(p<0.001).
As expected, the analysis of the local midsubstance strain revealed
anon-homogeneous strain field from clamp-to-clamp. However, our analysis showed
that midsubstance strains for all 3 tests were around 12% in each strain rate
group(10–14% local strain). Differences in local midsubstance strains were
found to be insignificant among different strain rate groups. Mechanical data
revealed fascicles were not pulled past the linear region.
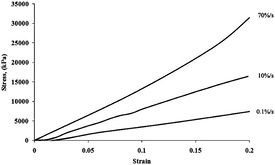
Fig. 2. Tensile testing to 20% clamp-to-clamp strain with 3 different rates showing rate sensitivity (engineering stress vs.engineering strain).
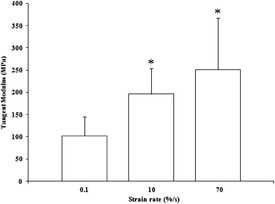
Fig. 3. Average tangent modulus of tendon fascicles (n=6), taken from 5% strain. * indicates p<0.05 vs. 0.1%/s.
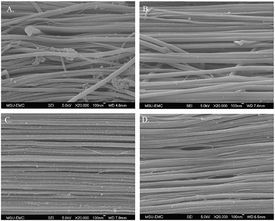
Fig. 4. SEM images of control sample(A), 0.1(B), 10(C), and 70%/s(D) tests.
Fig. 5. D-period analysis of 3 strain rates(n=90) with measurements normalized to control(n=50). * indicates significant difference between all groups(p<0.005).