Cementitious Materials
Ultra-High Performance Concrete (UHPC) with Fiber Reinforcement
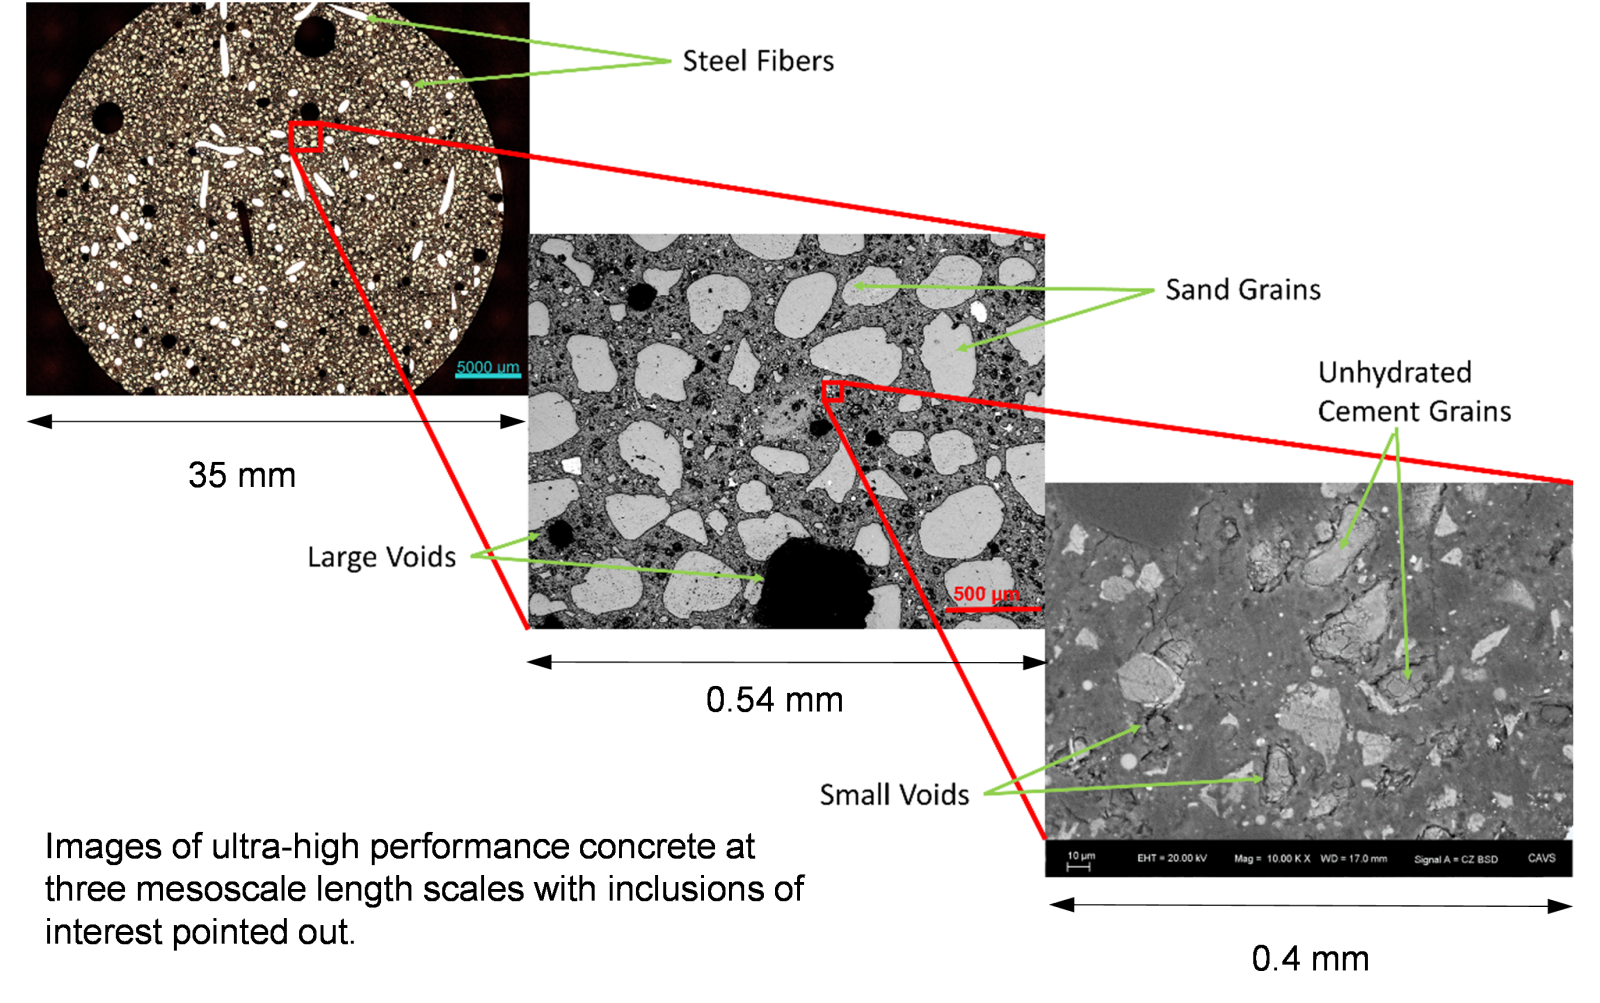
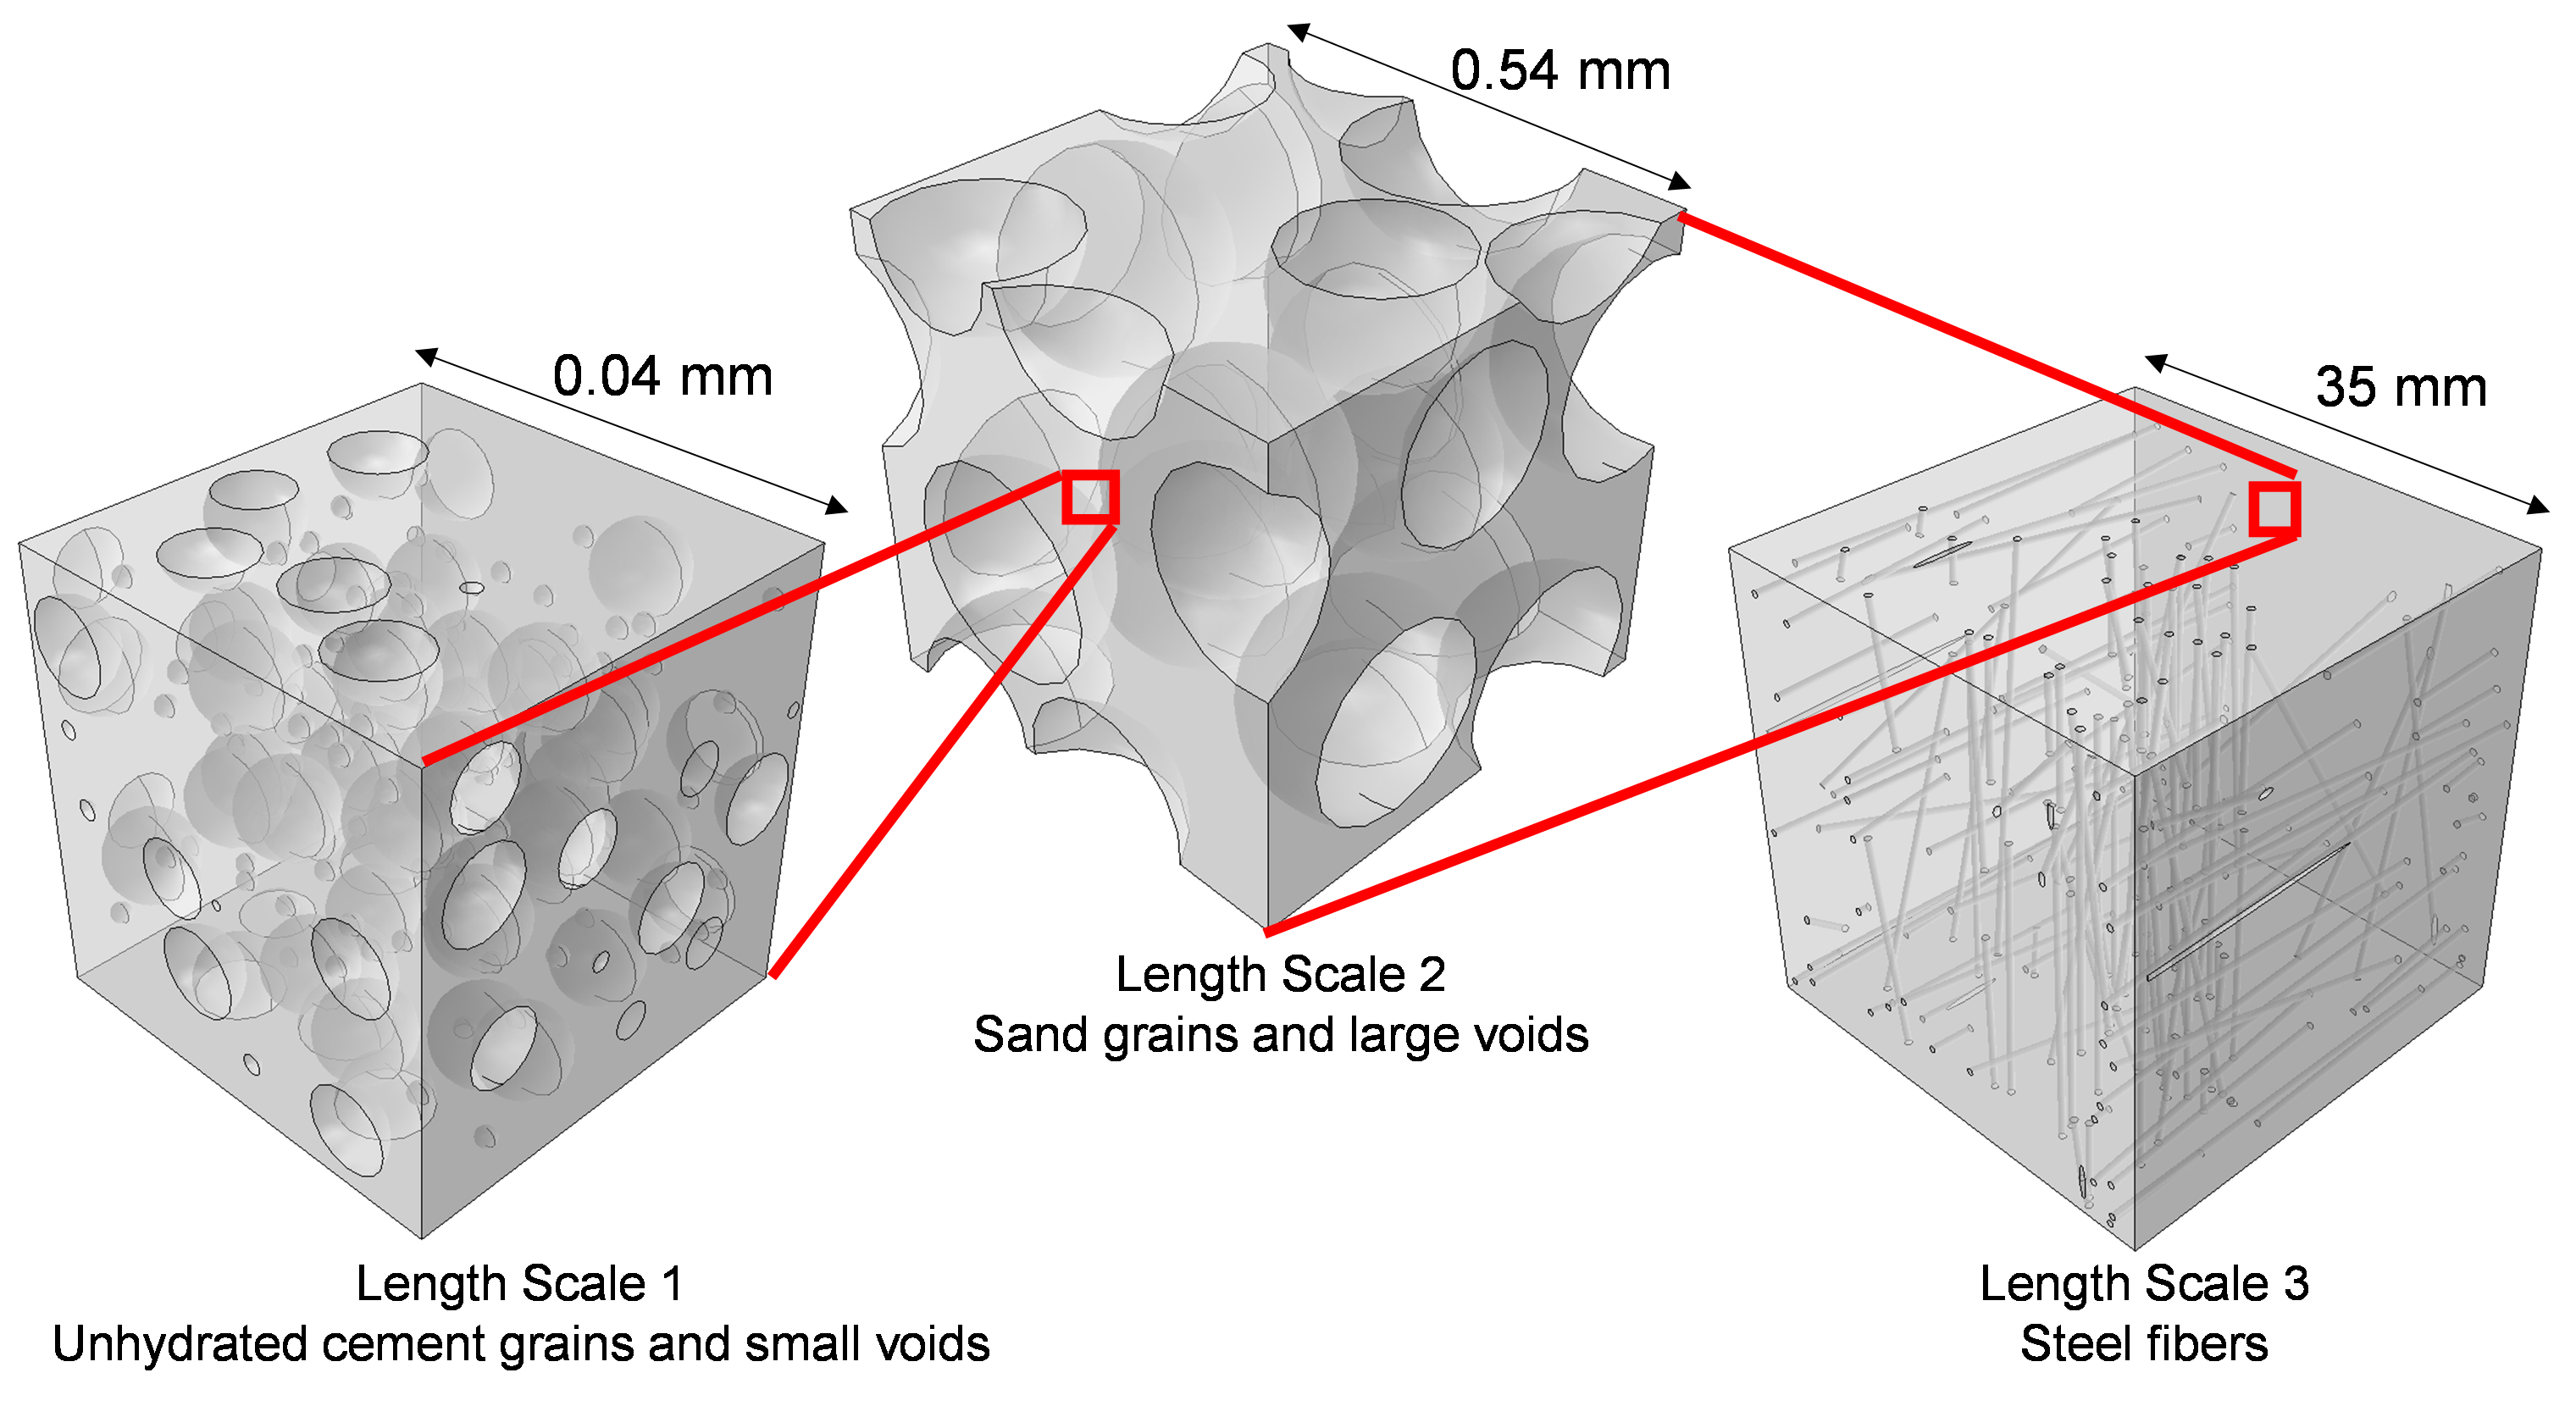
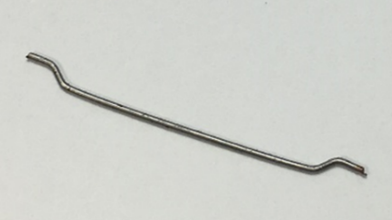
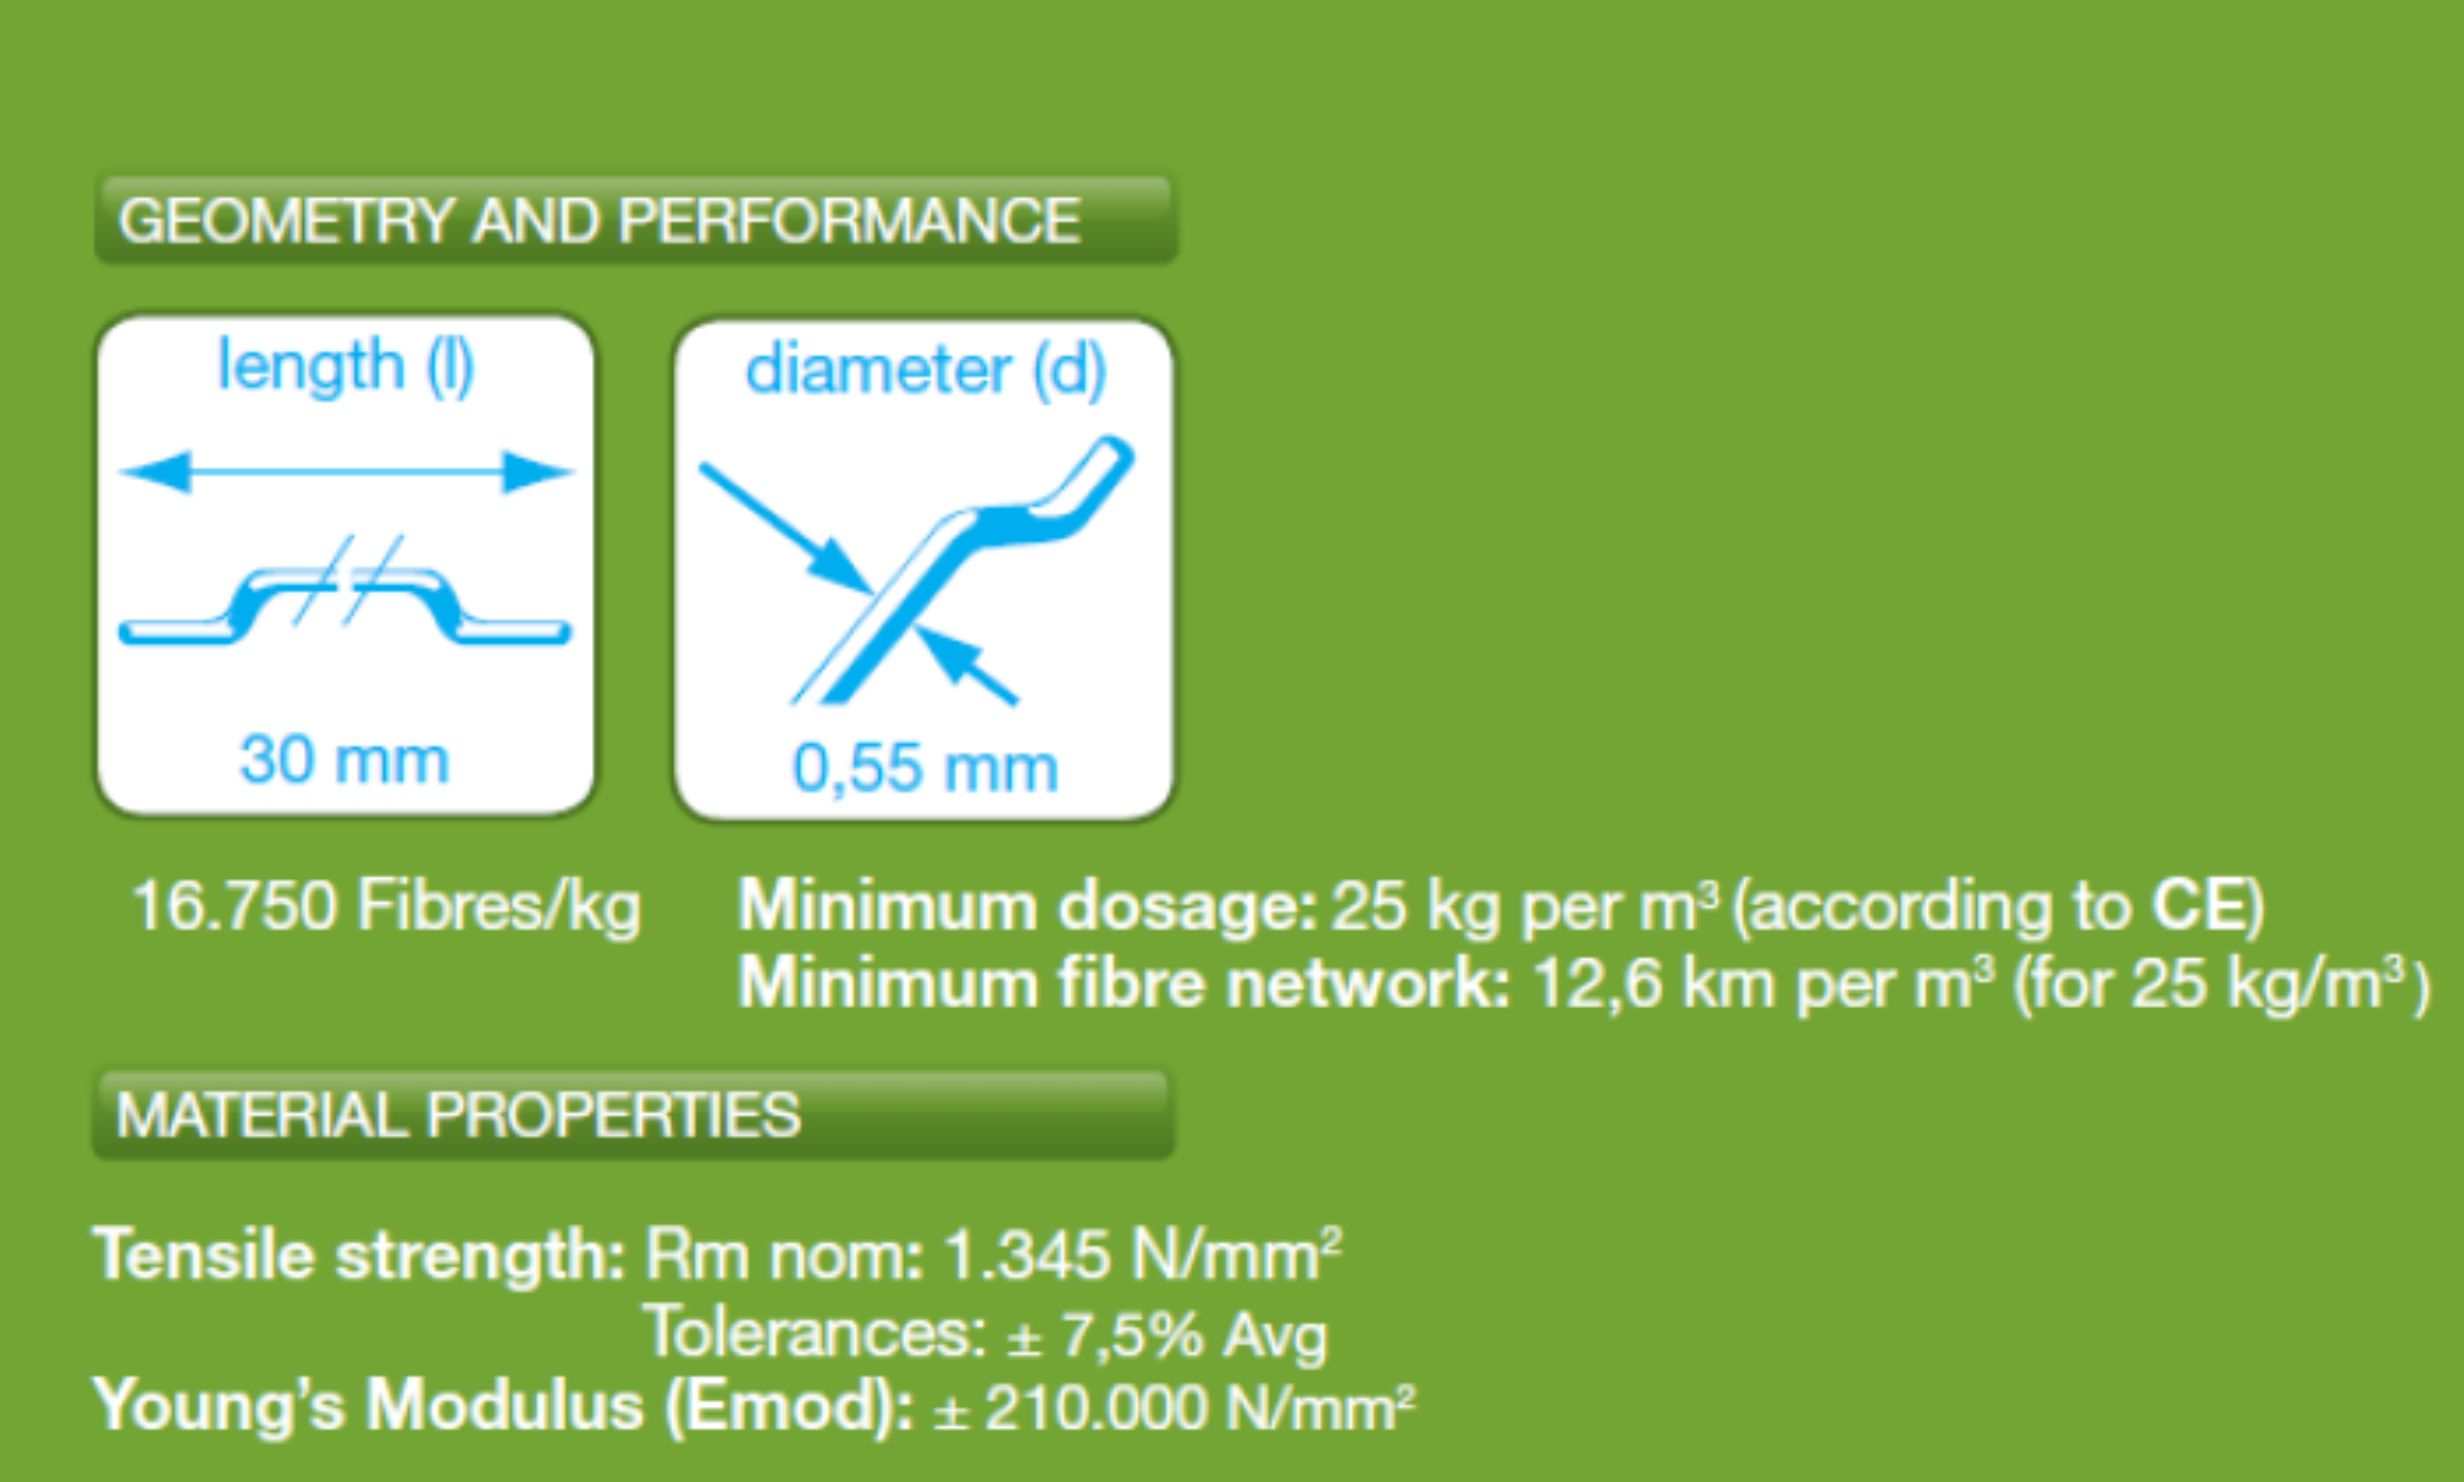
CAVS researchers were able to quantify the structure-property relationships of Ultra-High Performance Concrete (UHPC) by utilizing our imaging techniques to characterize the multiscale hierarchical heterogeneities and the mechanical properties. UHPC’s composite-like structure called for the inclusion of different sized inclusion types such as steel fibers, sand grains, unhydrated cement grains and voids. Through image analysis, the average size, percent area, nearest neighbor distance and relative number density of each inclusion type was determined and then used to create Representative Volume Element (RVE) cubes for use in Finite Element (FE) analysis.
By using multiple length scales of mesocale FE modeling, the bridge of information to the macroscale cementitious material model is more physically based.
- The largest length scale (35mm side length) includes steel fibers
- The middle length scale (0.54mm side length) includes large voids and silica sand grains
- The smallest length scale (0.04mm side length) includes small voids and unhydrated cement grains
- Multiscale modeling aspects of bringing in lower meso-/micro-length scale using finite elements
- Conduct mesoscale finite element analysis on individual constituents of concrete (including cement, steel fibers, aggregates composed of sand, gravel, etc.) at meso-/micro-scale, lower than continuum macro-scale
- Obtain image analysis on series of SEM images of concrete showing individual constituents’ distributions and interfaces, as microstructure information for optimal FE meshing and subsequent modeling
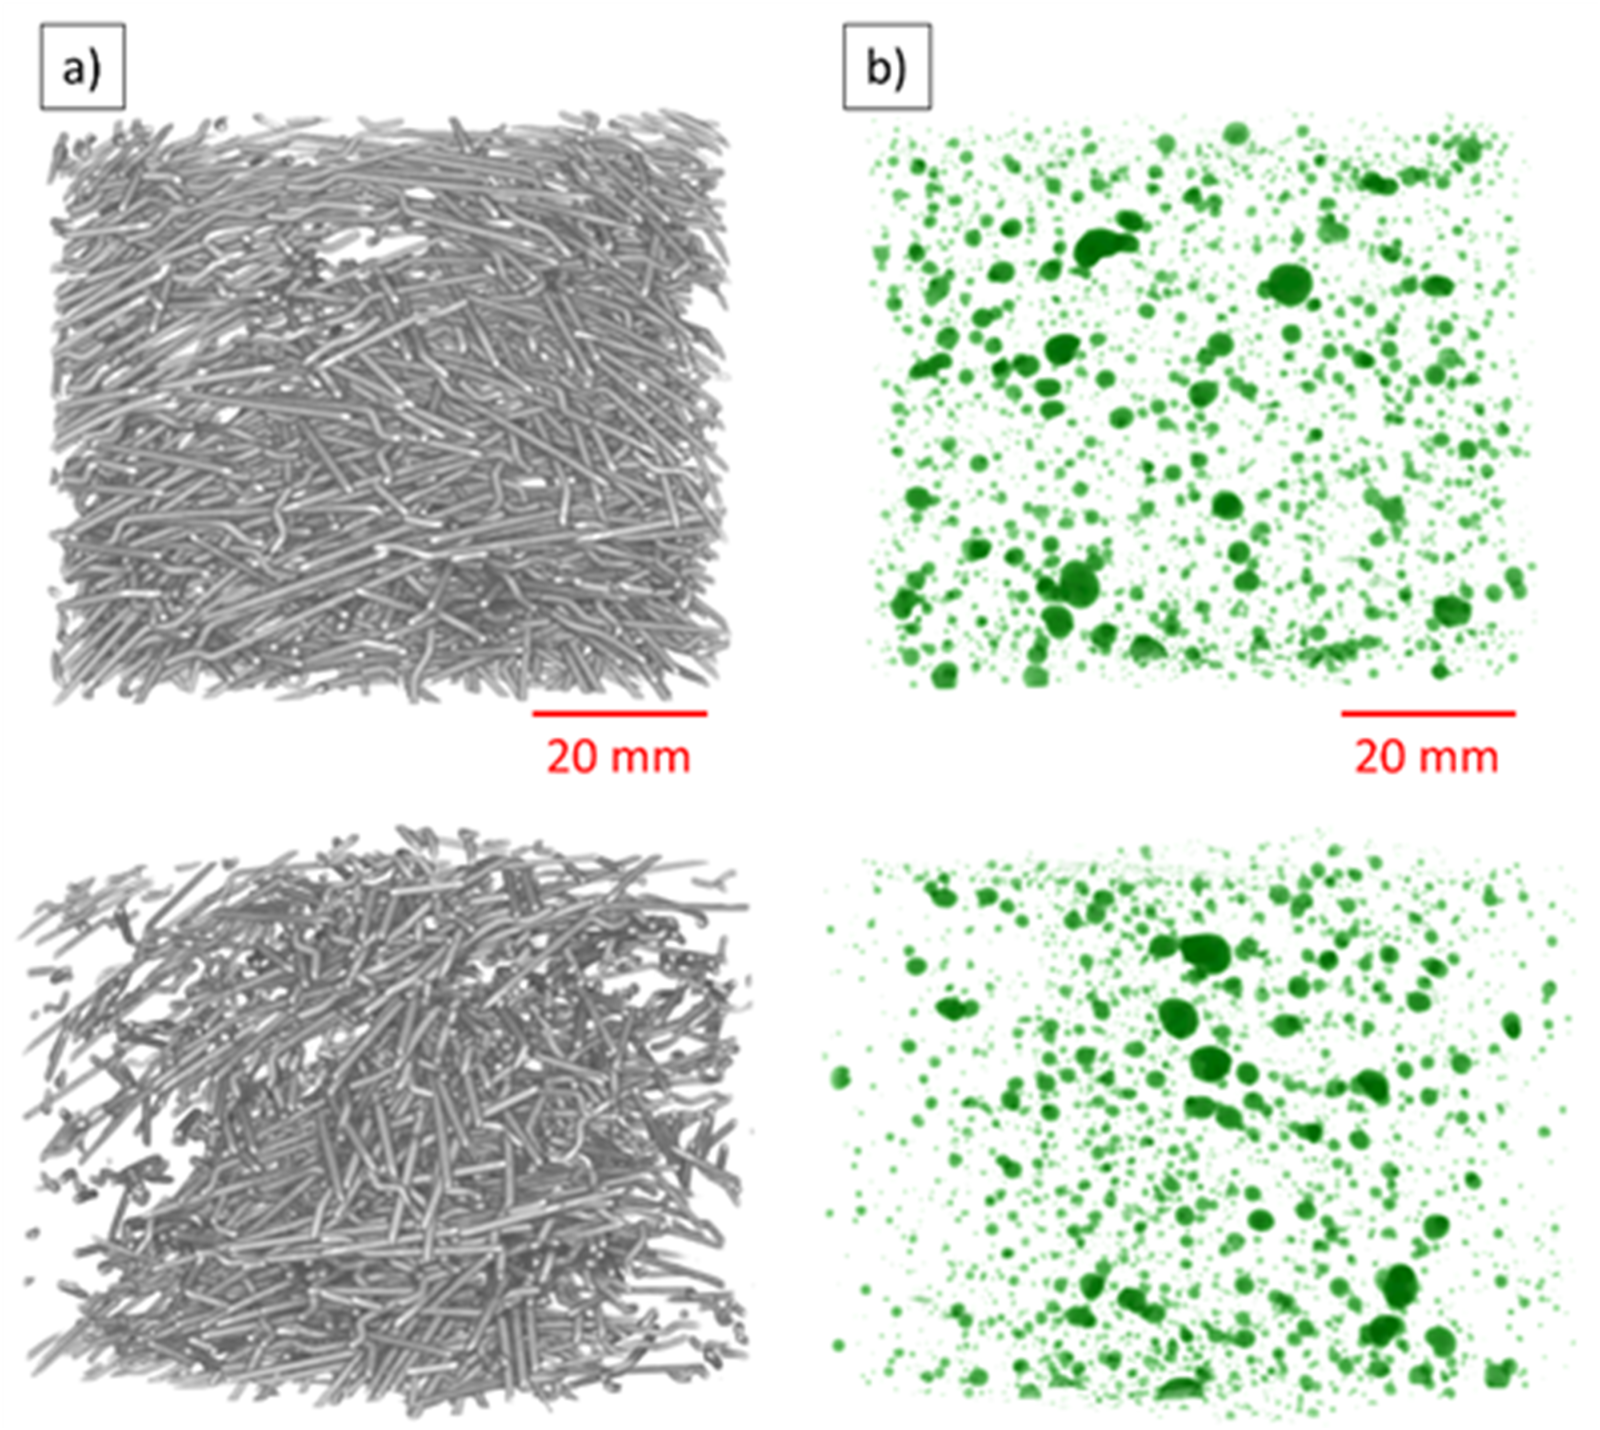
- a) approximately 3% steel fibers
- b) large voids illustrated; note that although the material's behavior is isotropic, there is local anissotrophy from the fibers
| Average Volume % | |||
| Inclusion | Mortar | Fiber-Reinforced Paste | Ultra-High Performance Concrete |
| Air | 4.54 | 1.83 | 2.42 |
| Sand Grains | 18.1 | - | 29.2 |
| Fibers | - | 5.18 | 3.18 |
Macroscale and Continuum Modeling
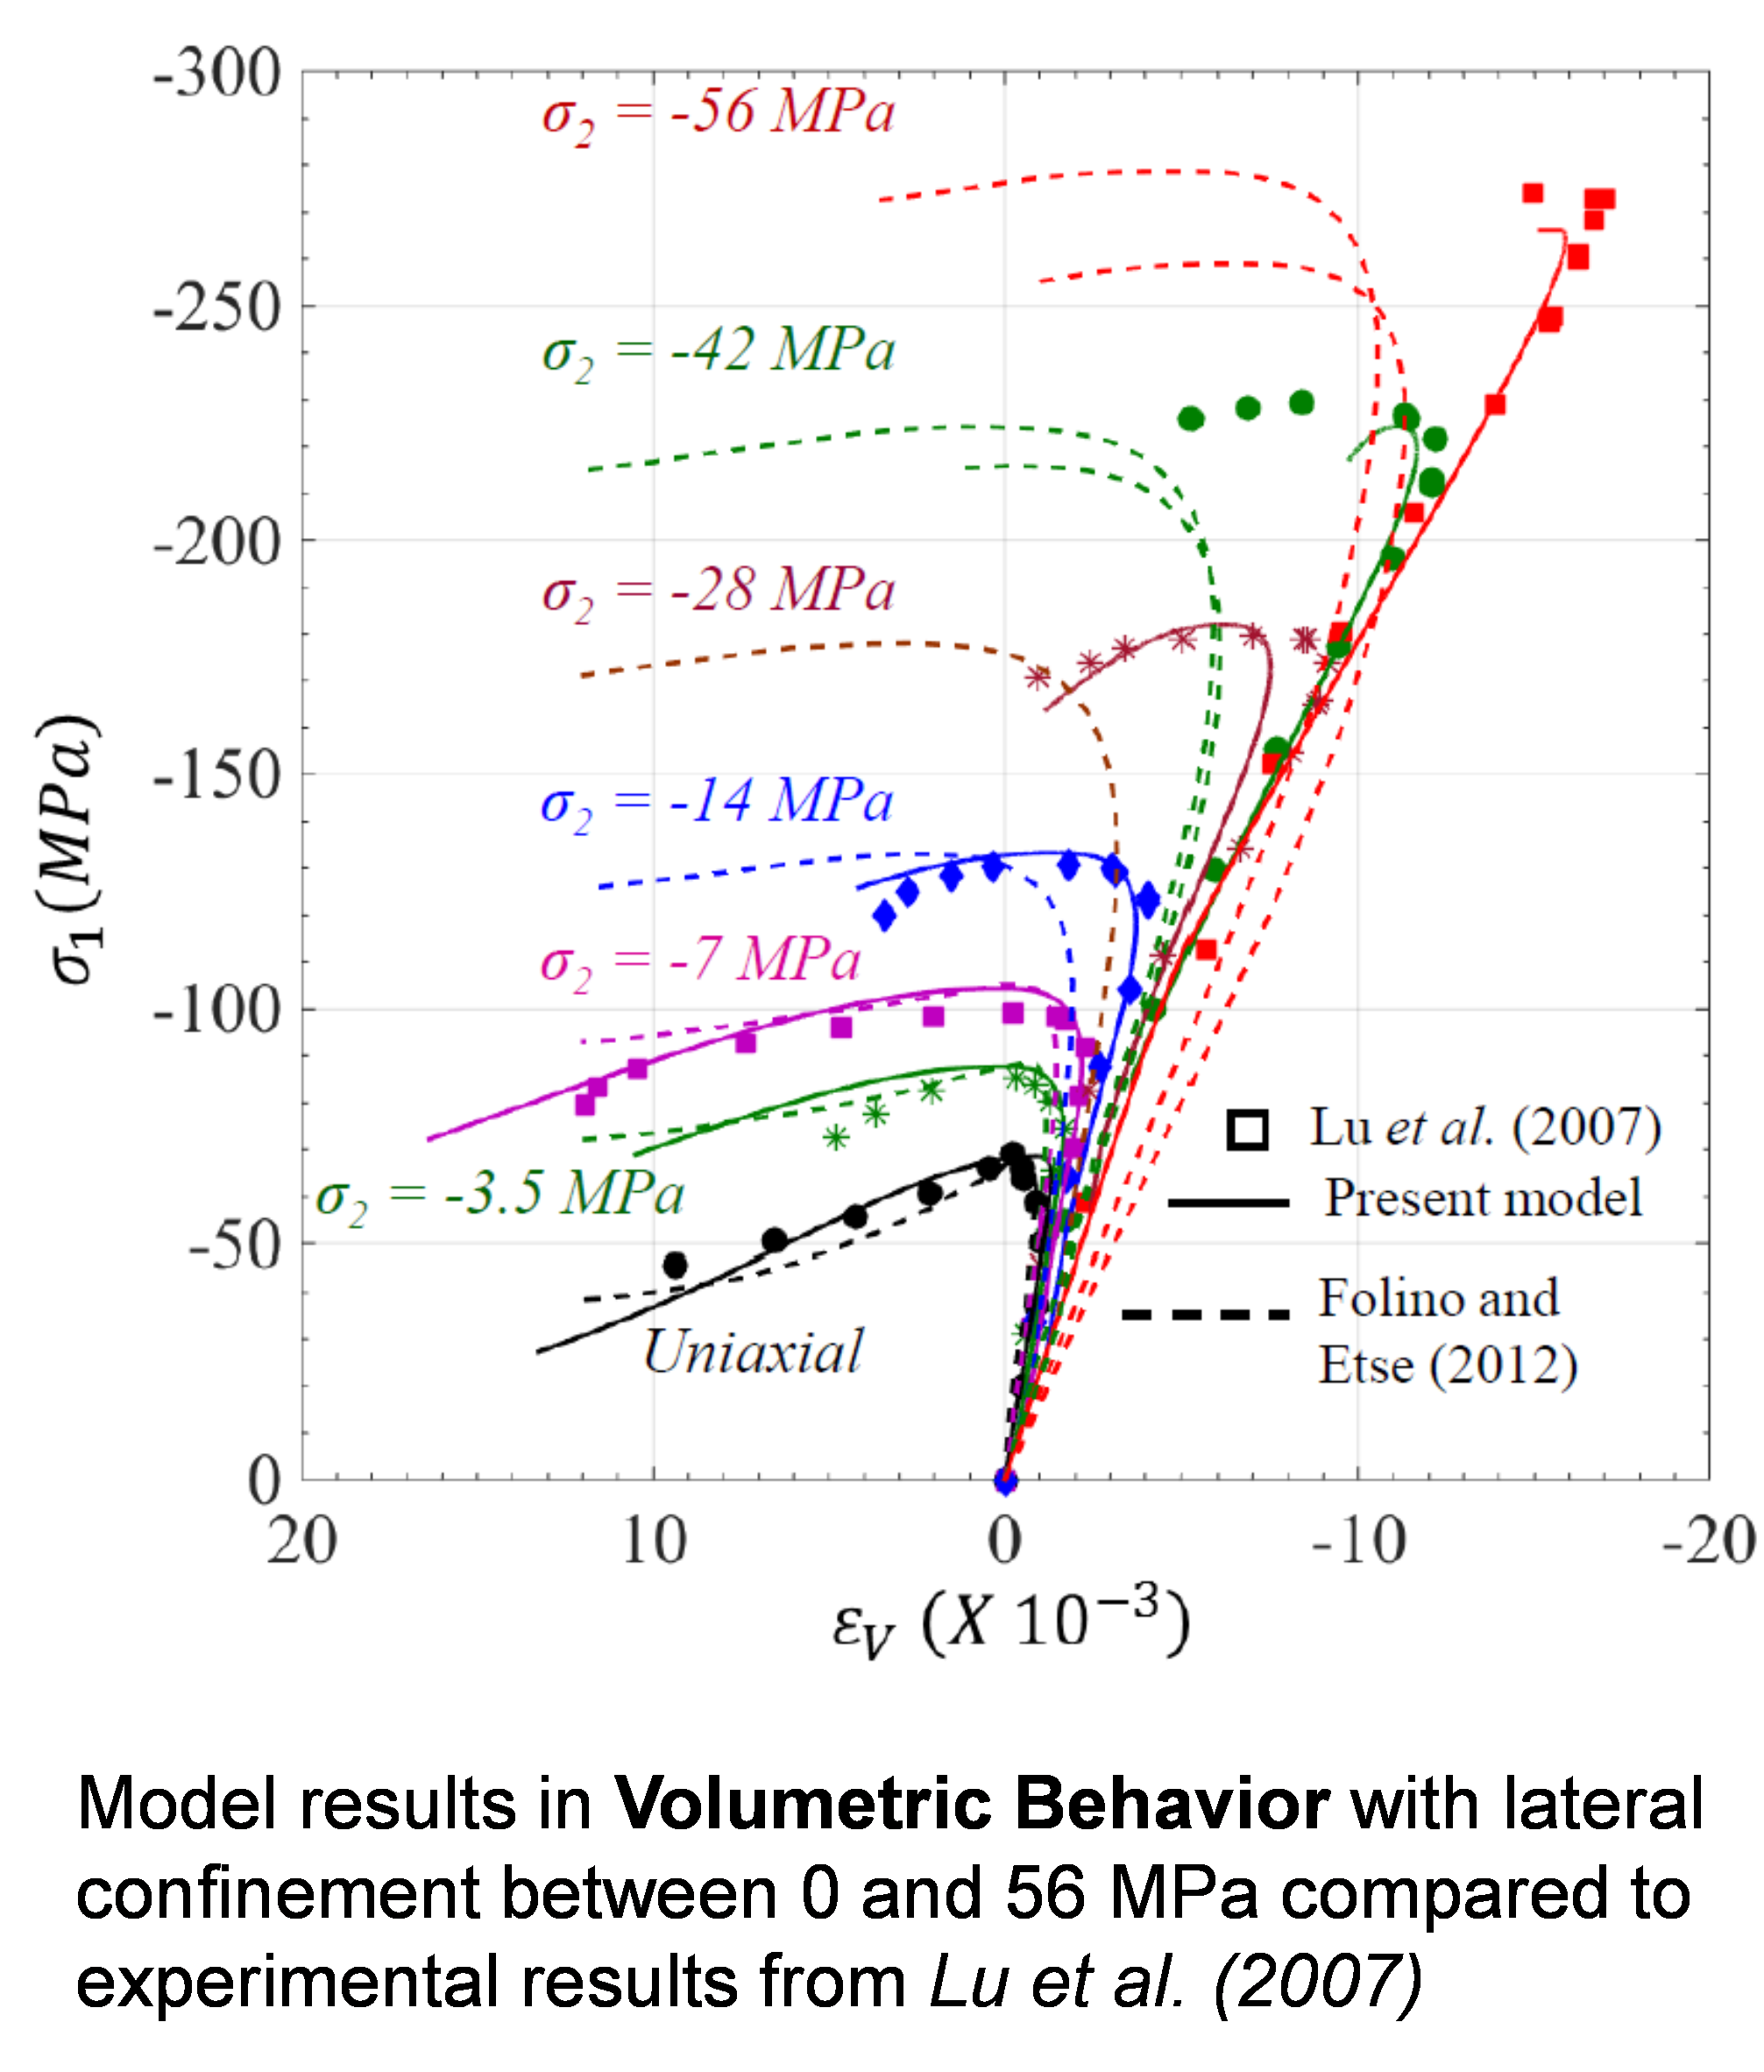
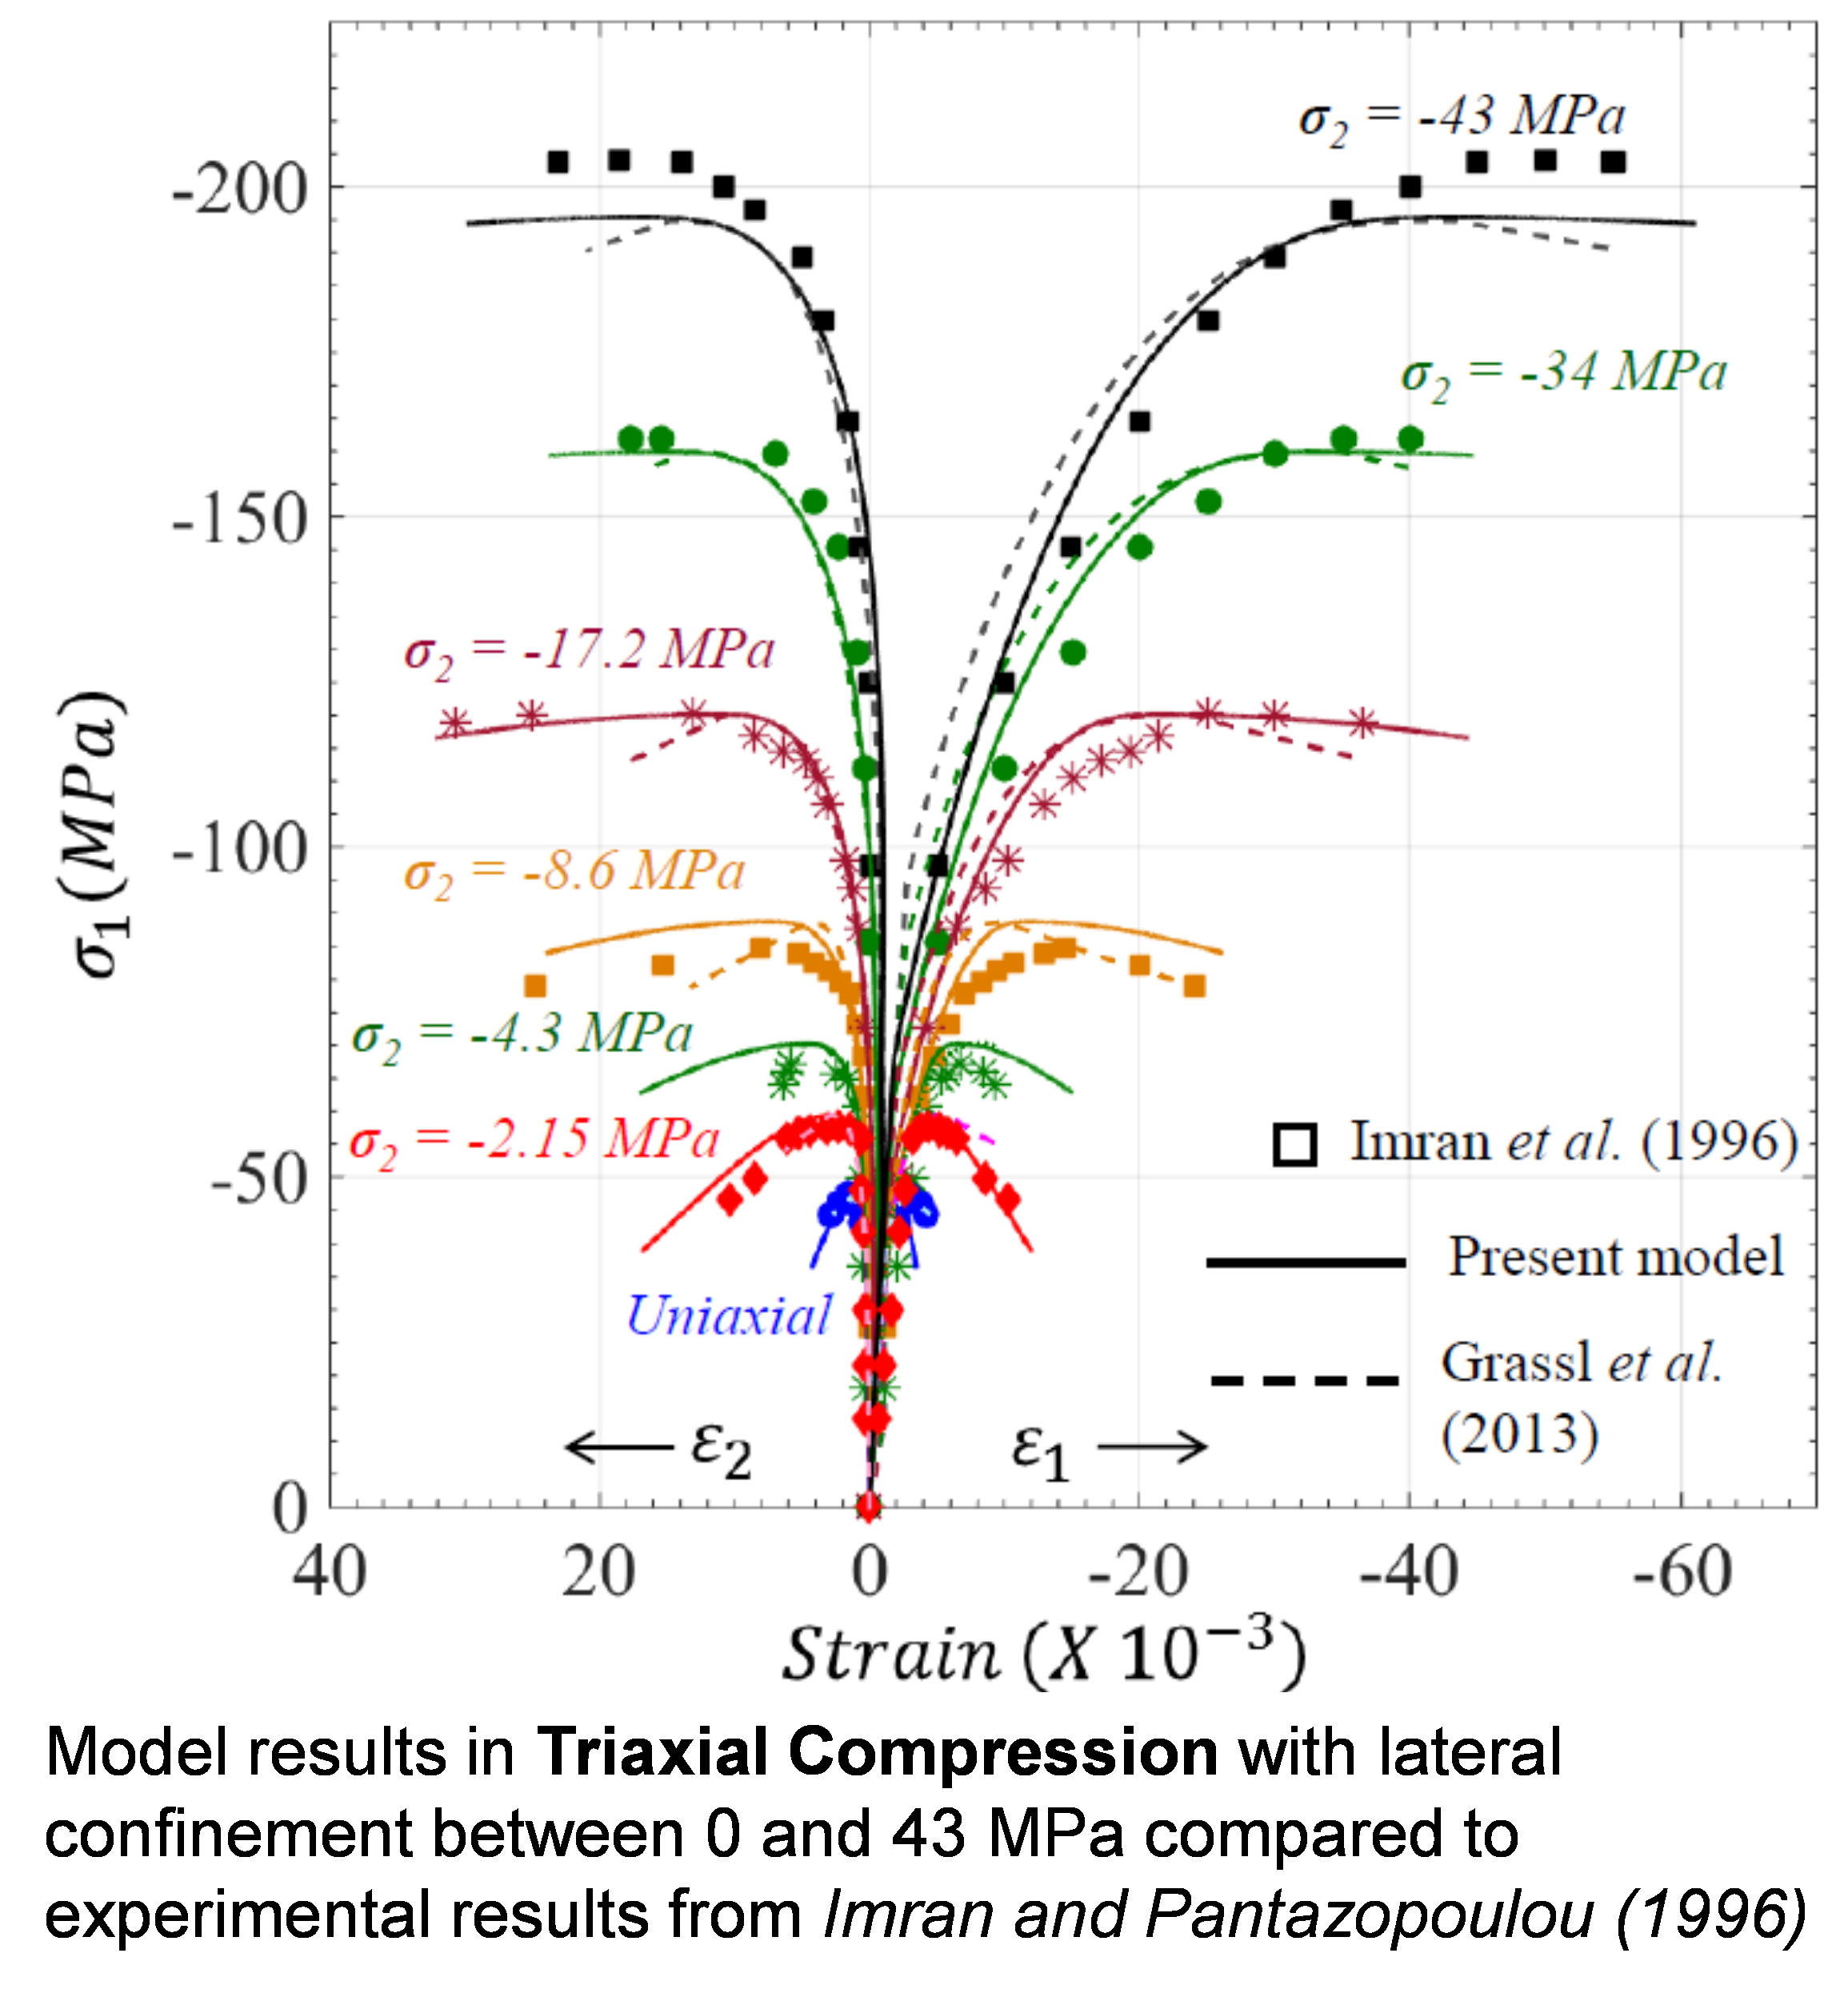
Concrete material is represented by a new continuum elastoplastic damage model for cementitious materials, which captures its distinct behavior in both tension and compression, due to crack-induced damage and irreversible plastic deformation. This model also describes the material's response under multi-axial loading with low to high confining pressures.
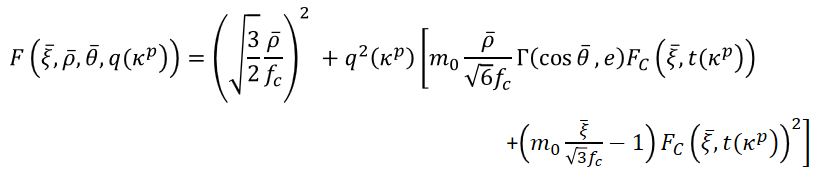
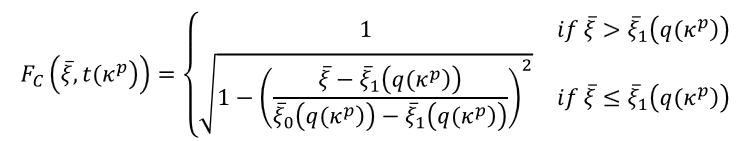
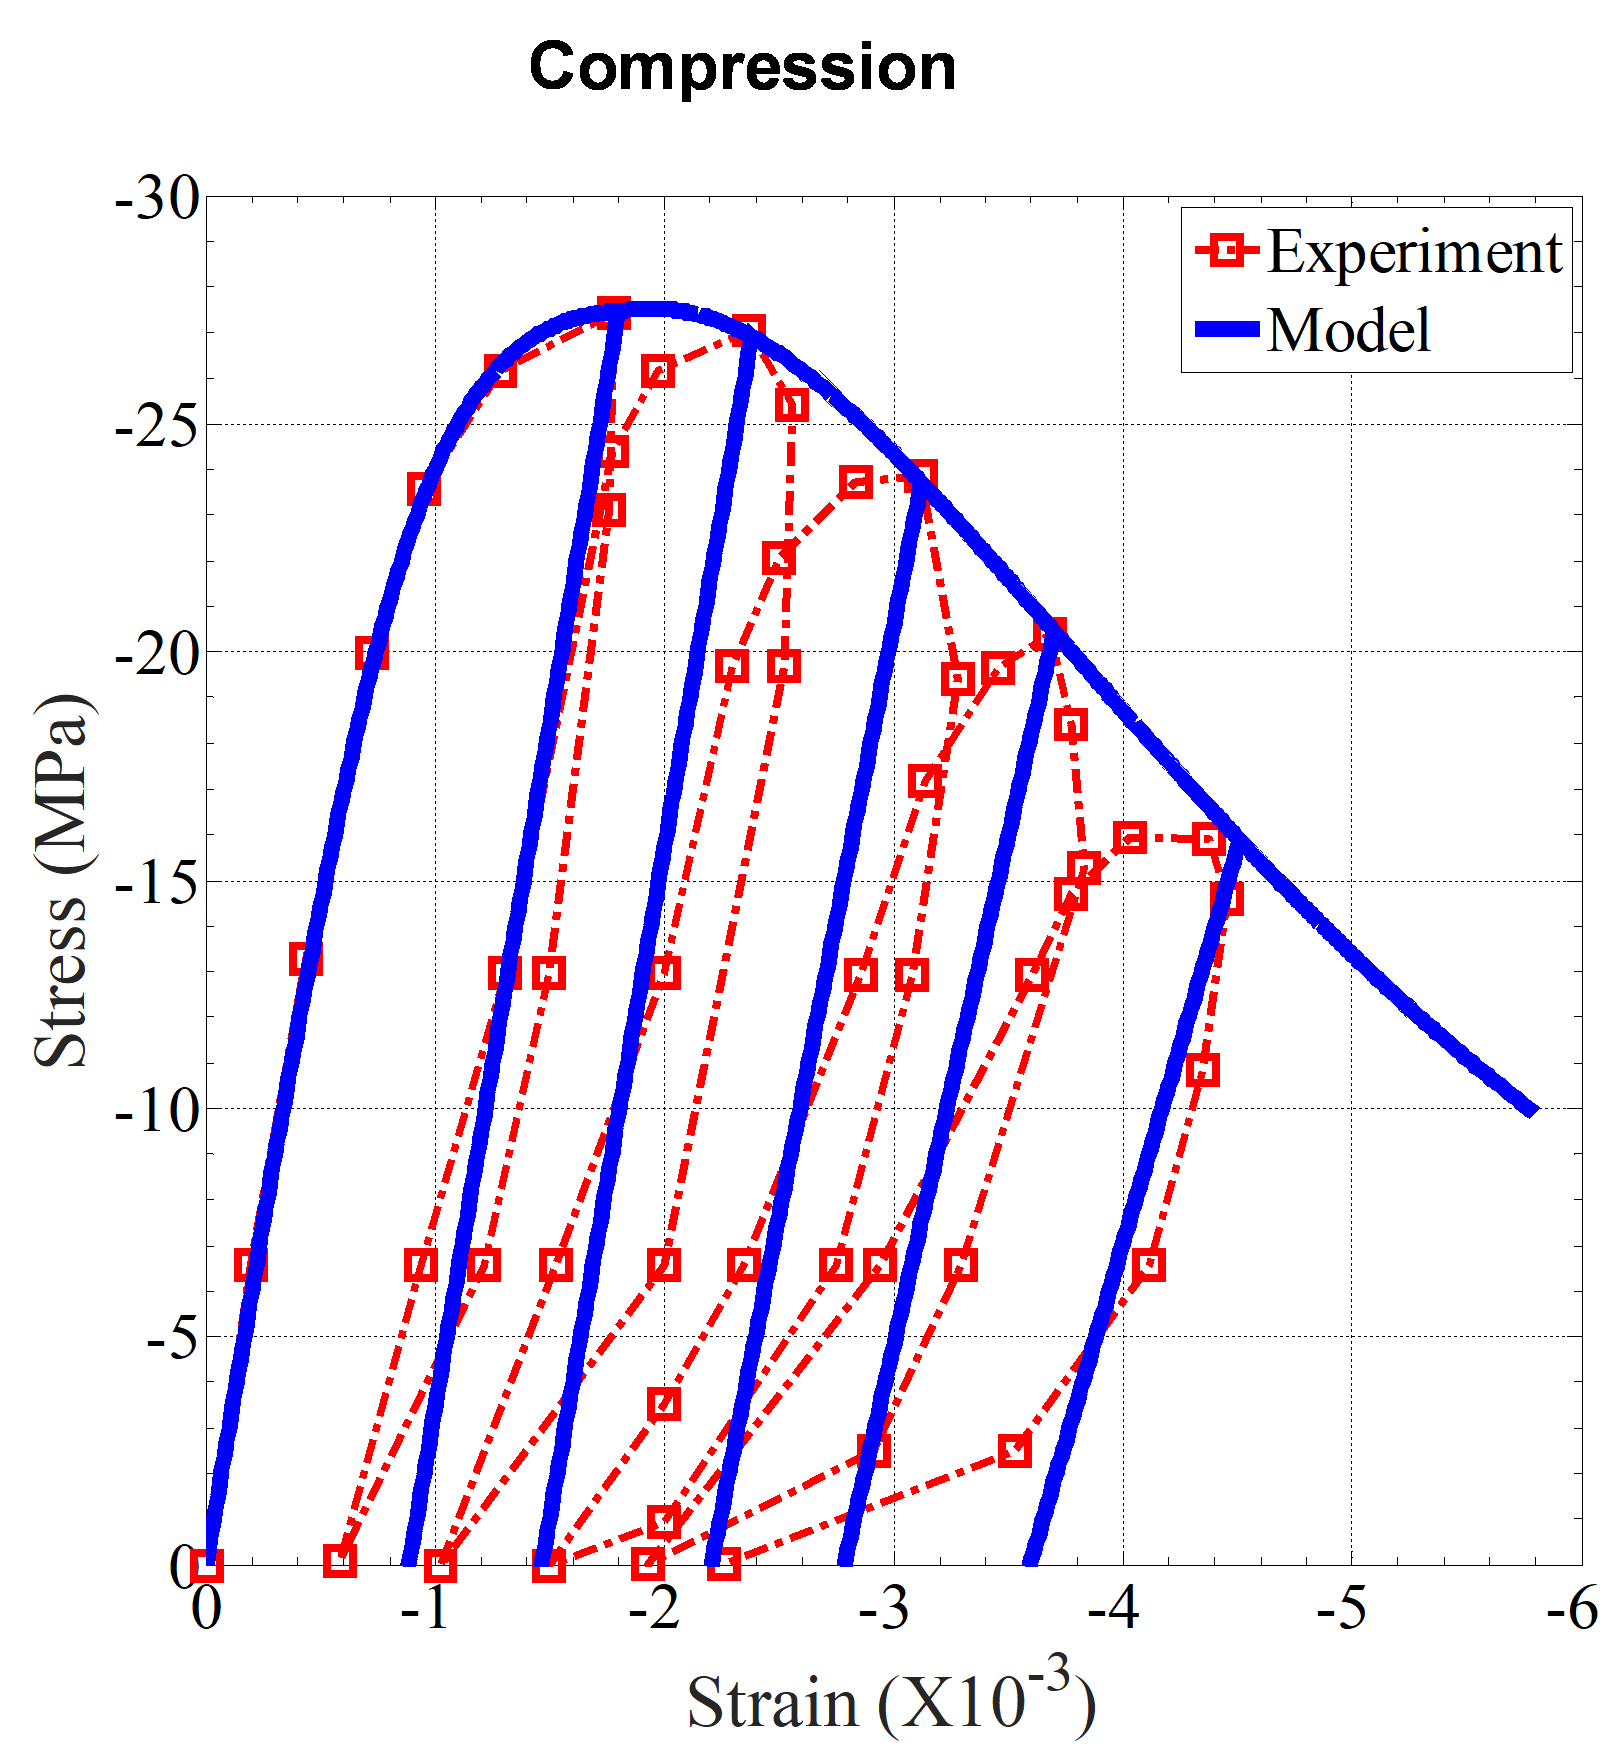
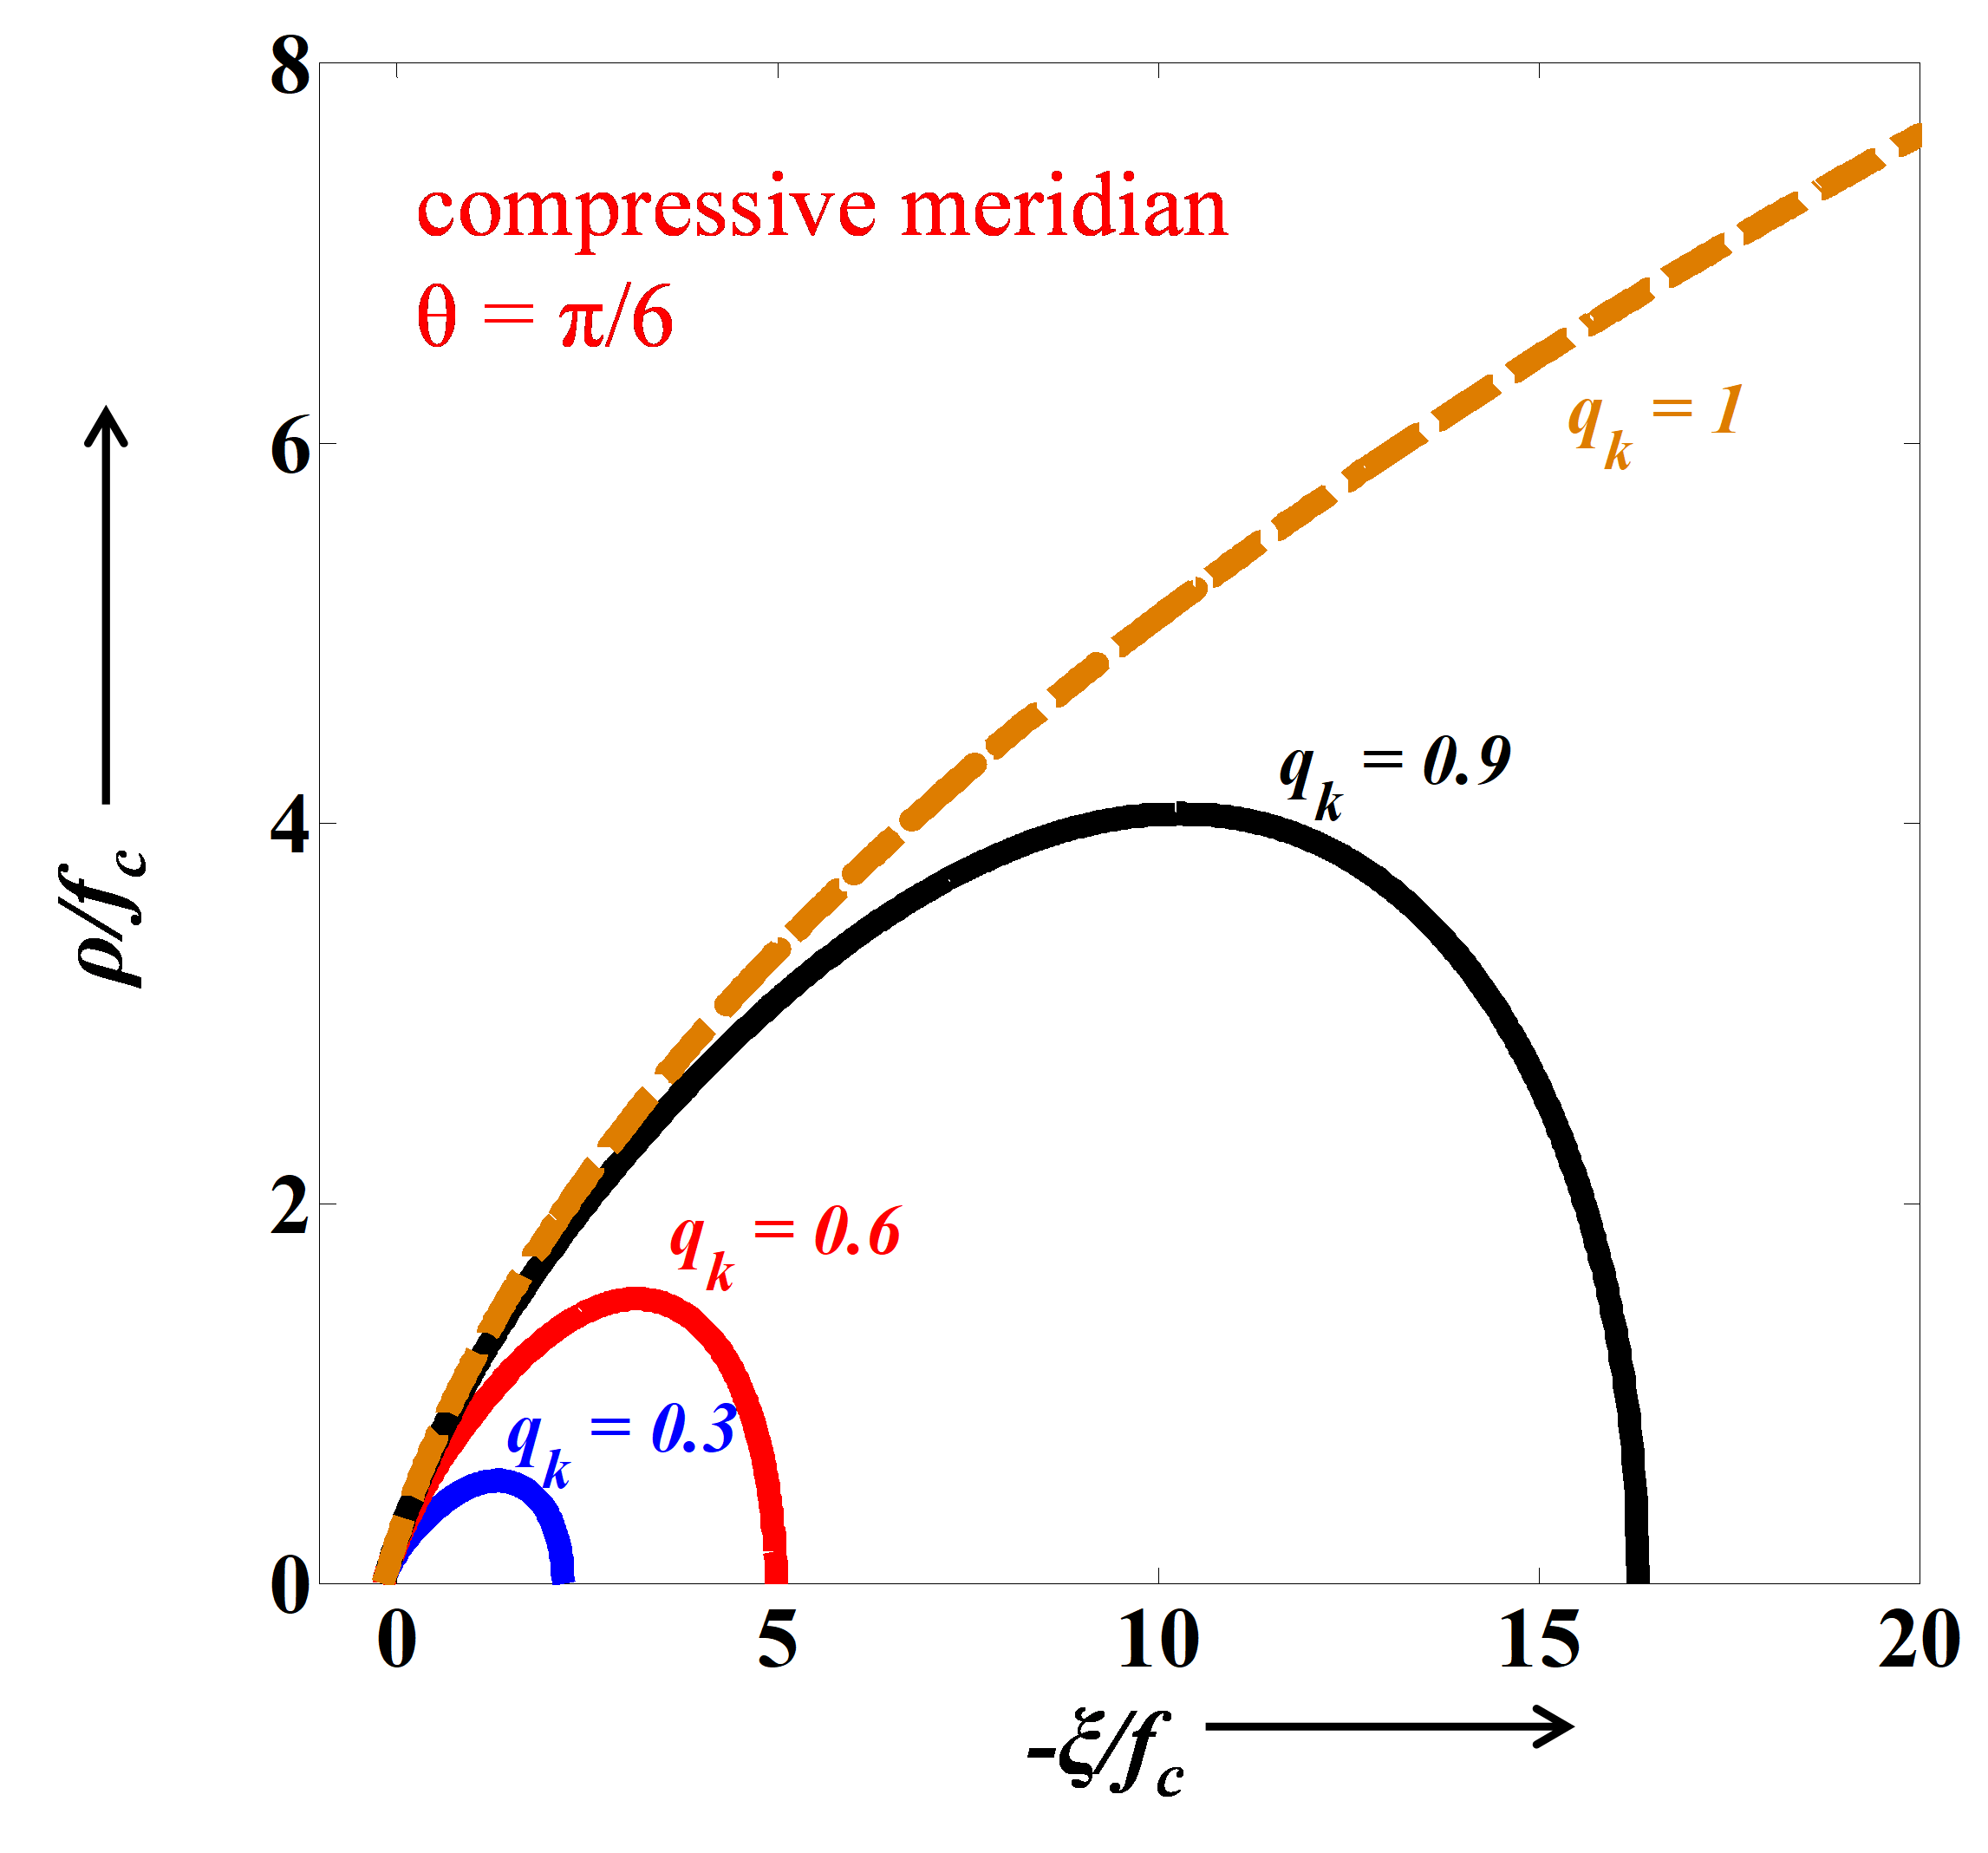
A smooth, closed-convex three stress-invariant yield surface is developed, which perpendicularly intersects the negative hydrostatic axis, and is composed of a shear loading surface and an elliptical cap. It incorporates a plastic internal state variable (ISV) characterizing non-uniform hardening of both shear loading surface and elliptical cap, while the flow rule is considered to have volumetric non-associativity. Damage evolution laws incorporate two ISVs describing crack growth at the macroscale under tensile and compressive stresses separately. Overall damage under multi-axial loading explicitly considers the effect of confining stresses on damage evolution and stiffness recovery effects under cyclic loading. The model predictions are compared against several experimental results on various concretes, as well as against responses of recently reported models.
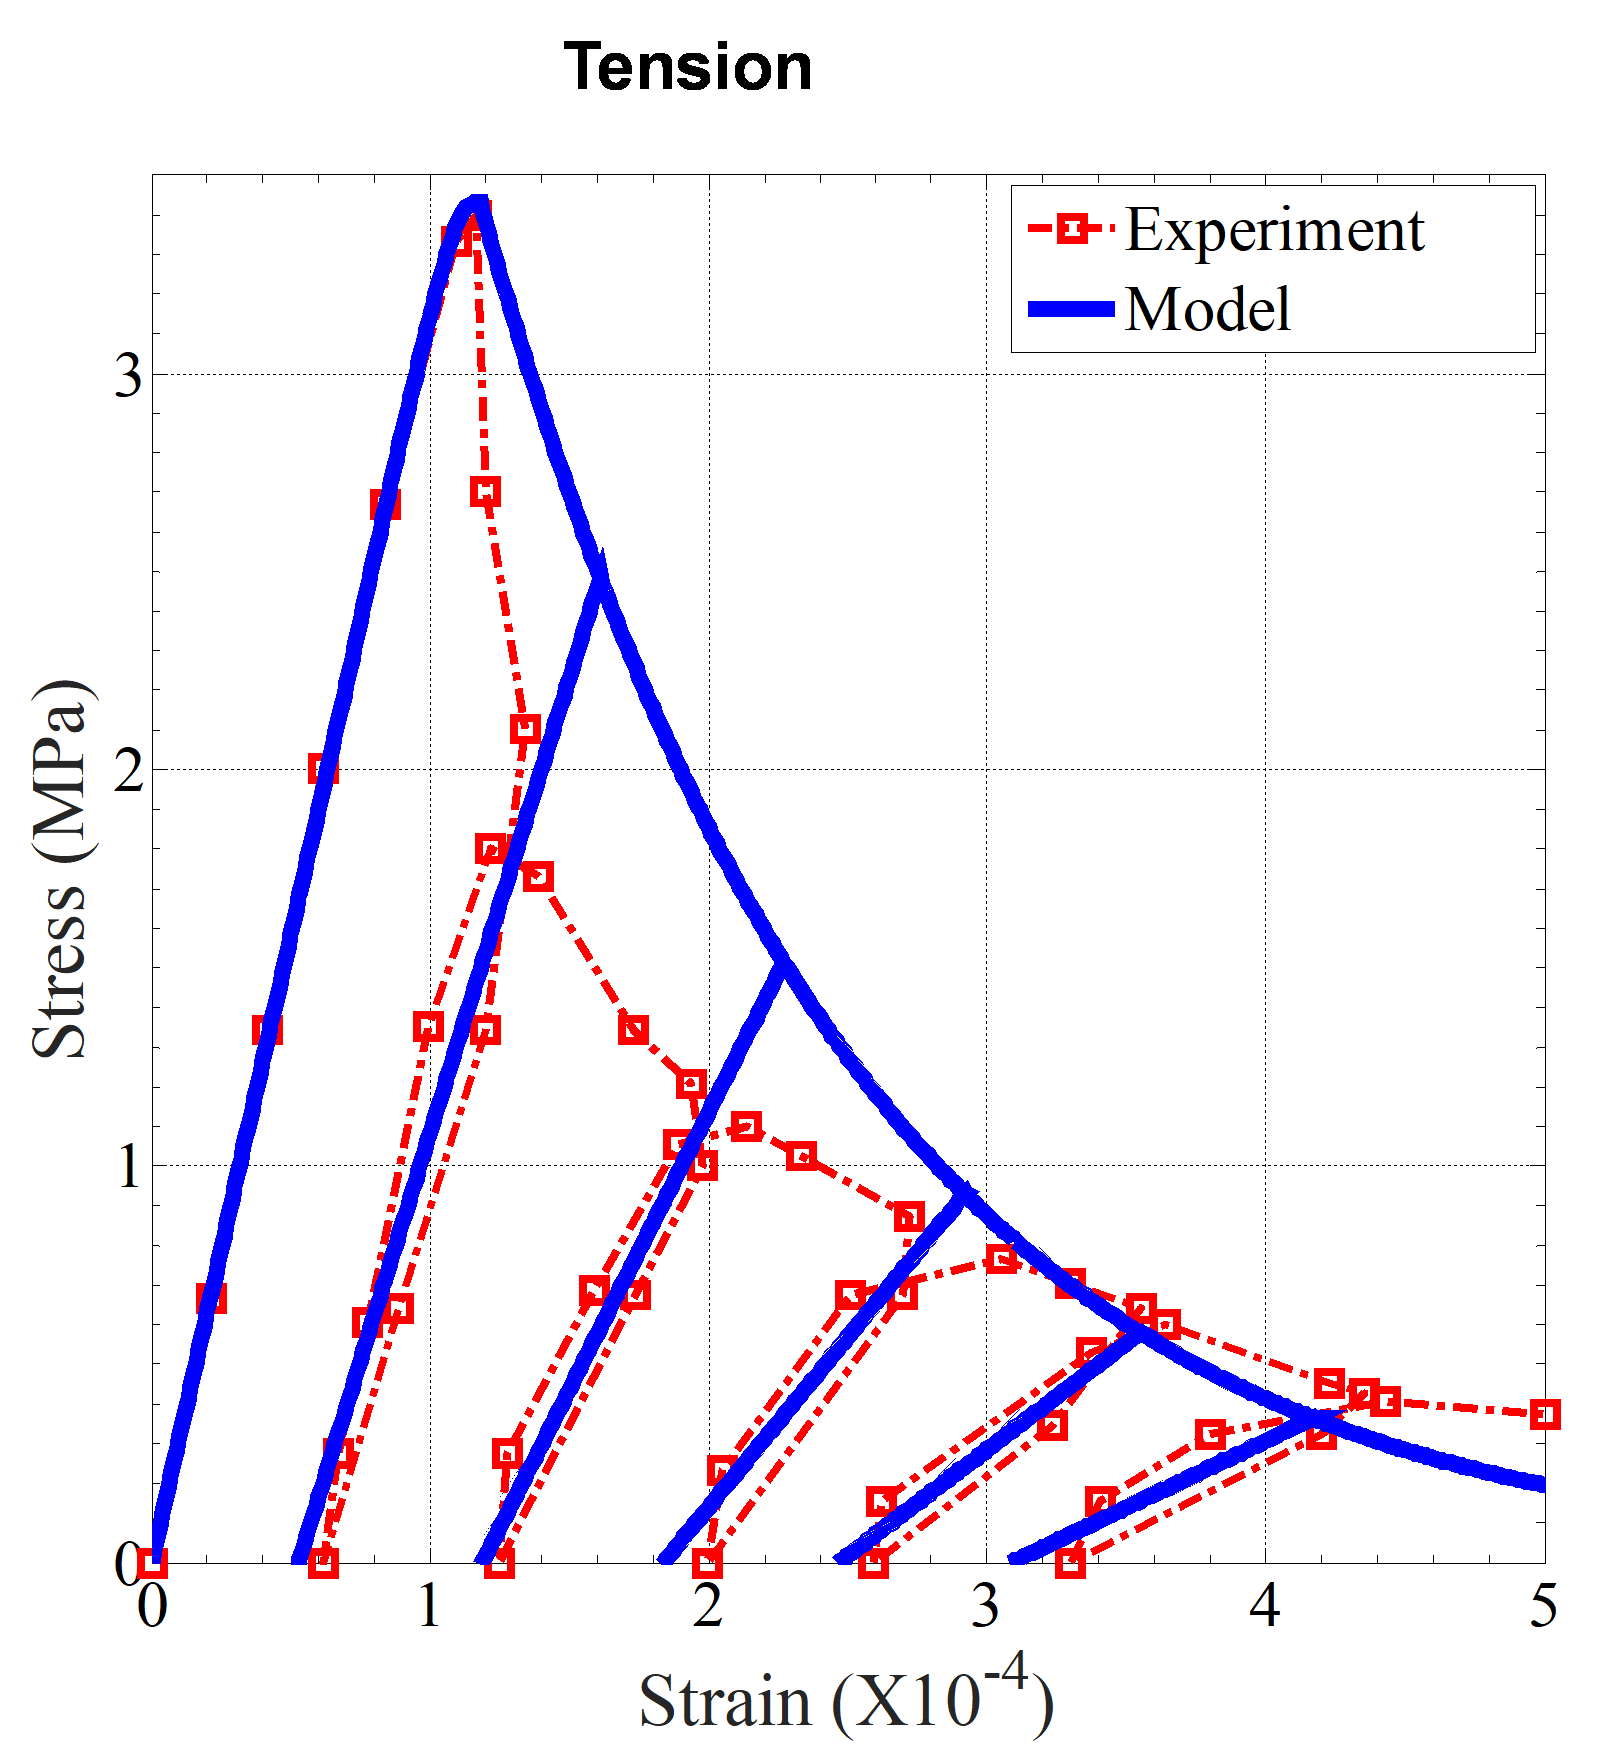
The proposed model predicts the distinctive features of concrete very well, including hardening behavior in triaxial-compression and both pre- and post-peak volumetric behavior.
- Formulate hardening functions based on ISVs describing the evolution of the yield surface during plastic flow and an appropriate combination between a hardening parameter and a plastic potential function for correctly estimating the deformation capacity of concrete under tri-axial compression.
- Formulate softening law based on continuum damage mechanics using appropriate ISVs separately accounting for tensile damage and compressive/shear damage.