
Integrated Computational Materials Engineering (ICME)
Uniaxial Compression Copper
Abstract
Uniaxial compression behavior of porous copper samples
having a wide range of initial porosity prepared by Spark Plasma Sintering
(SPS) process is presented. Simple analytical model is developed for evolution
of porosity and flow stress during uniaxial compression based on the Gurson
model which was initially developed for low porosity solids (< 10%) having
simple pore geometry. A unique linear relationship was observed for normalized
porosity (porosity/initial porosity) with strain and normalized flow stress
(flow stress/flow stress of matrix). The model predictions are in good
agreement with the experimental results over a wide range of porosity (2–25%)
and strain (0–0.26). Furthermore, a new model for strain hardening rate is
developed which explains the significant strain hardening observed in the
uniaxial compression tests. The observed strain hardening rate of the porous
samples depends not only on the strain hardening rate of the matrix material
but also on the extent of pore closure during compression. While the relative
contribution of the strain hardening rate of the matrix largely dominates the
observed response, the contribution due to pore closure is significant for
samples with high initial porosity, especially at higher values of strain.
Author(s): [Bolla Reddy Bodapati, P. Sudharshan Phani, P.P. Bhattacharjee]
Corresponding Author: [G. Sundararajan]
Methodology
Samples for uniaxial compression were prepared using Electro Discharge Machining (EDM) (EXCETEK-V650, Taiwan) wire cut having a wire diameter of 0.3 mm. Samples had a square cross section with a side length (W) of 6mm and a height (L) of 9mm so as to maintain the L/W ratio at the recommended value of 1.5 for uniaxial compression tests. Prior to compression, MoS2 was applied on the specimen surface to minimize the contact friction with platens. Cu samples with different porosity levels were compressed using Universal Testing Machine (INSTRON; Model: 5583, UK) at room temperature. All the tests were conducted at an initial strain rate of 3.7×10⁻⁴ s−1 (constant cross head speed of 0.2 mm/min). Suitable load cell (i.e. close to the maximum load on the lowest porosity specimen) was employed to obtain more accurate measurements with respect to load. Digital Image Correlation (DIC) (vic-2D-2009, correlated solutions, USA) technique was utilized to track the displacements. Since the DIC attachment works better with a square cross section, compression samples were fabricated with a square cross-section as indicated earlier. Samples having porosities in the range 2–25% were compressed to different levels of strains i.e. 0.08, 0.17 and 0.26. The load displacement data obtained during the test was converted to true stress – true strain values as per the standard procedure. To calculate the yield stress, 0.2% offset method was used.
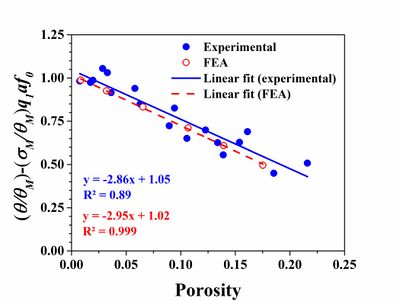
Figure 1. Variation of the non-dimensional parameter with porosity for the experimental data and FEA predictions.
Material Model
To explore the effect of porosity on the post yielding compression behavior, FEA of uniaxial compression was carried out for different initial porosities using a commercially available FEA package, ABAQUS 6.9. The compression platens were assumed to be rigid, while the specimen was modeled using 5175 linear hexahedral elements of type C3D8R. The specimen dimensions were similar to the experiments (6×6×9 mm). The bottom surface of the specimen was fixed along the compression direction, while a displacement was specified to the top surface to simulate uniaxial compression. A friction coefficient of 0.1 was assumed between the platens and the specimen. Gurson model was chosen as the material constitutive law and compression simulations were carried out for six different initial porosities. Gurson model provides a simple approach to study the effect of porosity on the flow stress through a continuum approach without having to explicitly model the pores as discrete entities. The choice of the Gurson model parameters q1, q2 and q3 will be discussed in detail in Section 5.1. The input flow behavior of the matrix was obtained by fitting the experimental data on 2% porosity sample (Cu2) to the following functional form, σ = A + B (εp ) where, σ is the flow stress, εp is the plastic strain, A is the yield strength (133 MPa), B and m are the fitting constants, which were found to be 600 MPa and 0.67 respectively. Strain rate effects are not considered in the matrix material and the Gurson model as the present work deals,with quasi static testing. Mesh convergence studies were performed to ensure mesh independence of the reported results. The load-displacement response, porosity, stress and strain evolution during compression for different initial porosities was recorded for further analysis and comparison with experimental data [1].
Input Data
Flow Stress, strain data for bulk material, six different porosities, material parameters q1 and q2 in Gurson model [2][3][4].
Results
Porous copper samples with a wide range of porosity (2–25%)
were obtained by varying the process parameters during spark plasma sintering.
Uniaxial compression tests were carried out on the porous samples to study the
evolution of porosity, flow stress and strain hardening rate. A unique linear
relationship was obtained for normalized porosity (ratio of porosity to initial
porosity) evolution with strain. Unique linear relationship was also observed
between the normalized flows tress (ratio of flow stress during uniaxial
compression to flow stress of matrix) and porosity which can be rationalized by
the Gurson model.
Furthermore, significant hardening was observed during uniaxial compression
independent of initial porosity and a new analytical expression was derived for
the strain hardening rate as a function of porosity. The strain hardening rate
largely depends on the strain hardening rate of the matrix material and the
extent of pore closure during compression. Finally, finite element analysis
based on Gurson model (which was initially developed for solids having less
than 10% porosity) was carried out to assess the validity of the Gurson model.
FEA predictions based on Gurson model were able to explain the experimental
observations for a wide range of initial porosity (2–25%) and strain (up to
0.26).
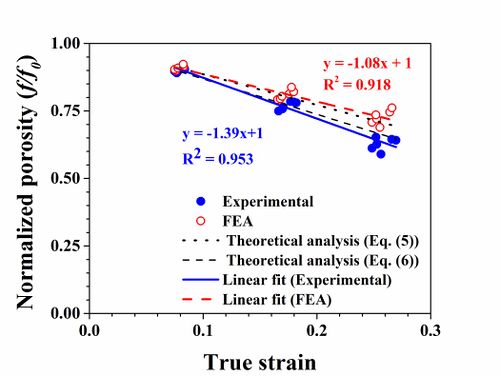
Figure 2. Comparison of experimental, FEA and theoretical results for normalized porosity (f/fo) during compression.
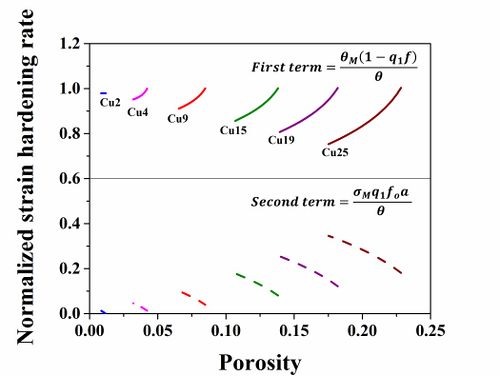
Figure 3. Comparison of the relative contribution of the two terms to the overall strain hardening rate, for samples with different initial porosity during compression. The solid lines represent the relative contribution of the first term and the dashed lines represents the relative contribution of the second term.
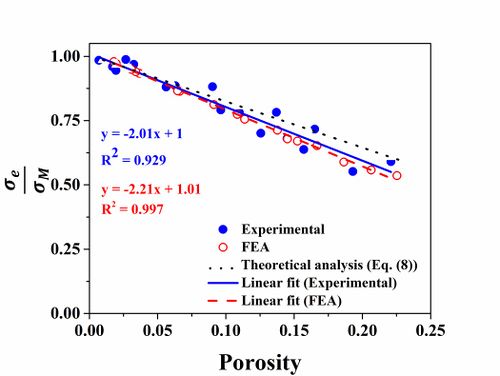
Figure 4. Variation of the non-dimensional parameter porosity for the experimental data and FEA predictions.
Acknowledgments
The authors wish to express their gratitude to the Director, ARCI for granting permission to publish this article. The authors would like to thank Mr. P V V Srinivas and Dr. S B Chandrasekhar for help in SPS and heat treatment. The authors also would like to thank Professor Atul H Chokshi and his doctoral student Hari, IISc Bengaluru, India, for help in uniaxial compression tests.
References
1. E. Parteder, H. Riedel, R. Kopp, Densification of
sintered molybdenum during hot upsetting: experiments and modelling, Mater.
Sci. Eng.: A 264 (1999) 17–25.
2. A.L. Gurson, Continuum theory of ductile rupture by void
nucleation and growth: part I—yield criteria and flow rules for porous ductile
media, J. Eng. Mater. Technol. 99 (1977) 2–15.
3. V. Tvergaard, Influence of voids on shear band instabilities
under plane strain conditions, Int. J. Fract. 17 (1981) 389–407.
4. V. Tvergaard, Influence of void nucleation on ductile shear
fracture at a free surface,J. Mech. Phys. Solids 30 (1982) 399–425.